In this tutorial we’ll learn the fundamentals of the ps, pstree, and top commands, to monitor processes in Linux.
When we start a Linux system, it starts with several processes. Some are system processes, and some are application processes set to trigger when we start a system.
We need to be able to monitor these processes. Depending on the situation, we may need to monitor active and child processes, or the amount of system resources they consume. To do this, we can use various commands, based on what we need to monitor.
Table of Contents
- Prerequisites
- The ps Command (Process Status)
- The pstree Command (Processes as a Tree)
- How to Use the pstree Command
- Show Threads for Each Process (pstree -t)
- Show Only Process Names (pstree -T)
- Show Processes for a Specific User (pstree <USER>)
- Show Tree for a Single Proceess (pstree <PID>)
- Show Parent Process Tree (pstree -s <PID>)
- Show Process Tree with PIDs (pstree -p)
- Show Process Tree for Process Name (pstree -p | grep <process_name>)
- How to Use the pstree Command
- The top Command (Real-Time Process Monitor)
- Conclusion
Prerequisites
- Access to a Linux machine
- Acting as a non-root sudo user to ensure a secure environment
The ps Command (Process Status)
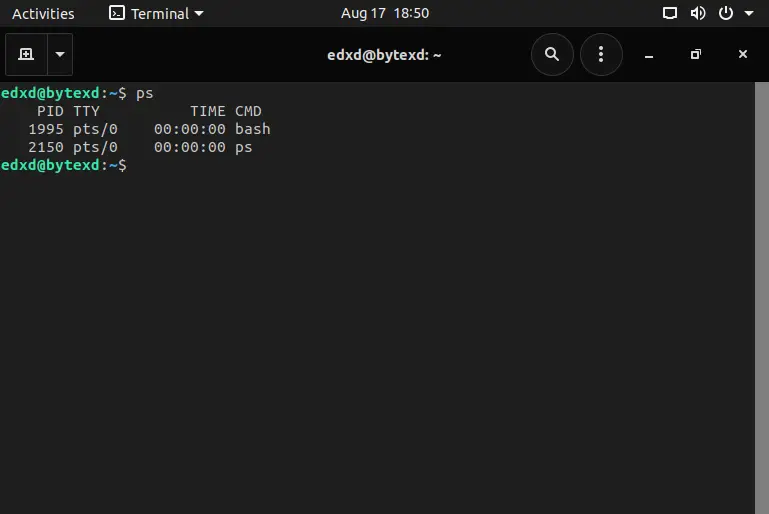
We may need to view the static processes running in the system. We can simply execute the following command to view them:
ps
We have used the ps command, which means Process Status.
This command displays the currently running processes for a particular user who is logged into the system. When we executed the ps command, the output displayed the currently running processes.
Notice that the output does not display several pieces of detail. It shows only two processes, which are bash and the ps command. It also shows the PID, TTY, and time.
How to Use the ps Command
We can also view all processes that are currently running. To do this, we need to use the aux option with the ps command. Let’s execute the following command:
ps aux
The output displays a long list of processes.
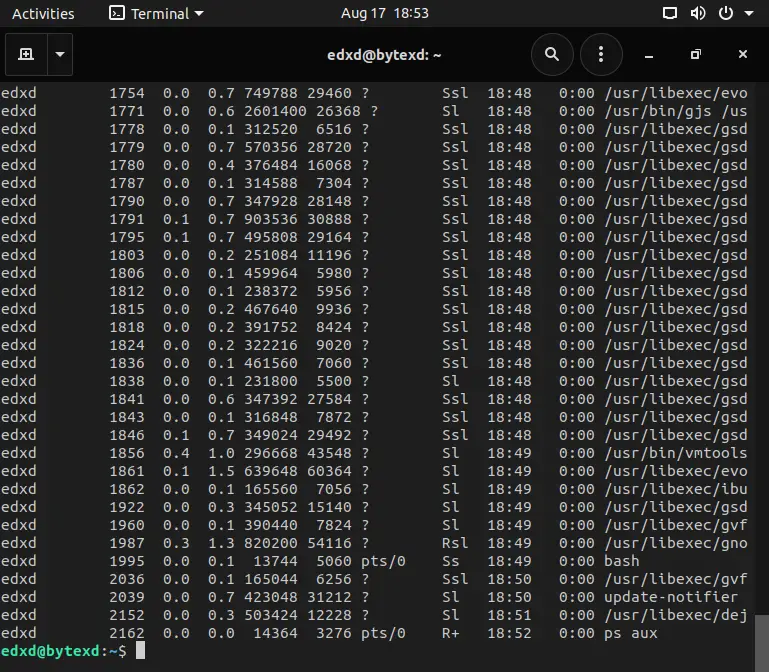
We need to scroll up to view the headers that will help us understand the information listed in various columns. Before doing that, notice that the output towards the end displays the username in the first column.
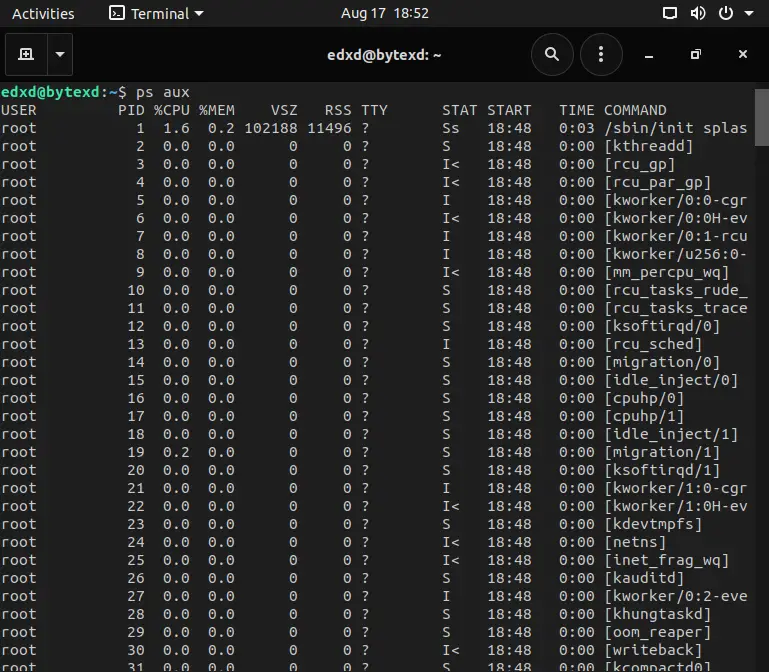
When we scroll up, we get the headers, such as user, PID, %CPU, %MEM, VSZ, RSS, TTY, STAT, START, TIME, and COMMAND. This is quite a bit of information. Also, notice in the USER column, there are processes listed from the root user as well.
Understanding ps Column Headers
Let’s quickly understand the column headers:
- USER: is the name of the user who started the process.
- PID: is the ID of the process.
- %CPU: is the percentage of CPU resources consumed by a process.
- %MEM: is the percentage of physical memory consumed by a process.
- VSZ: is the amount of virtual memory consumed by a process. It is shown in KB.
- RSS: is the amount of physical memory size consumed by the process.
- TTY: is the terminal that is running the process.
- STAT: is the process status, such as running (R), sleep but cannot be awakened (D), sleep and can be awakened (S), stop (T), zombie (Z), or locked into memory (L). These are some of the key process statuses.
- START: is the start time of the process.
- TIME: is the amount of time a process occupies the CPU.
- COMMAND: is the name of the command that started this process.
List Processes in Linux Standard Format (ps -le)
We can also list all processes in the Linux standard format.
To do this, we need to use the -le parameter, which includes two individual parameters, -l and -e. The -l parameter displays the output in the long format, which is about providing detailed information. The -e parameter displays all processes.
ps -le
ps -l -e or ps -le. Both the commands provide the same output.Notice that once again, a long output is generated. This is because all processes running in the system are listed. Because of the -l parameter, detailed information about the processes is displayed.
Let’s scroll up to see the column headers. Just like the ps aux command, several headers are listed.
Some are common, like TTY, TIME, and PID, to the ps aux command, but others are new.
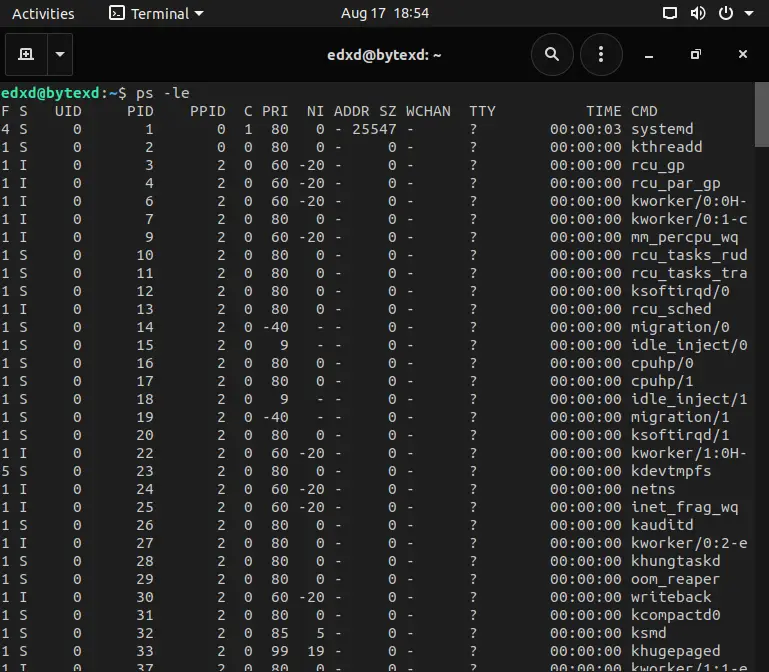
Let’s quickly look at the headers to understand them closely.
- F: displays the process authority by displaying a number. The number 4, for example, indicates that the process is executed with superuser authority.
- S: displays the process status.
- UID: displays the user ID who is running this process.
- PID: is the ID of the process that is currently running.
- PPID: is the ID of the parent process of the current process.
- C: displays the CPU usage by the process.
- PRI: displays the process priority. Smaller the number, the higher the priority.
- NI: is the nice value, which is also the priority of the process. Smaller the number, the higher the priority.
- ADDR: is the process address in the memory.
- SZ: is the memory consumed by the process.
- WCHAN: displays whether a process is running. If there is a dash (-) status marked, it means that the process is running.
- TTY: is the terminal that is running the process.
- TIME: is the amount of time a process occupies the CPU.
- CMD: is the name of the command that started this process.
List Processes for Specific User (ps -U edxd)
Let’s now look at the user-specific commands.
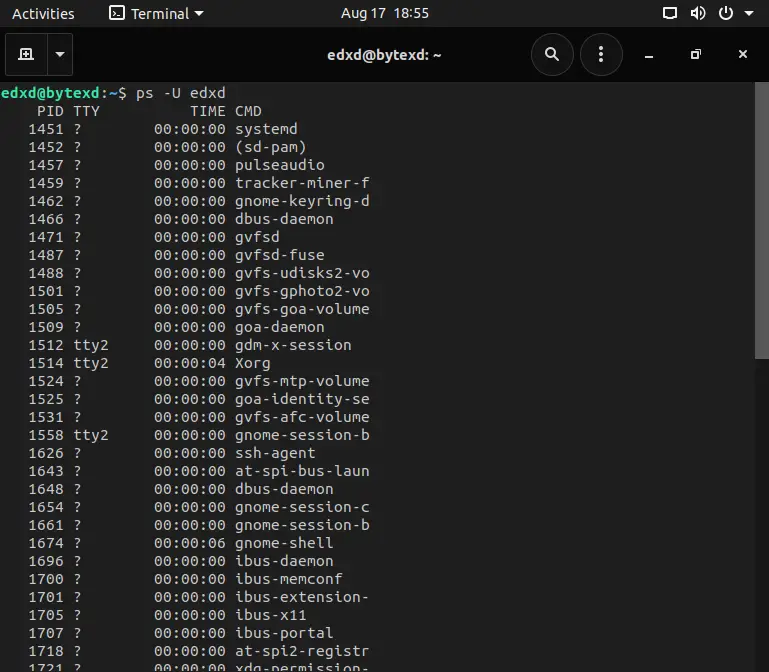
To do this, we need to use the -U parameter along with the username. For example, let’s say that we want to view the processes for edxd user. To do this, we need to execute the following command:
ps -U edxd
After we scroll to the headers, it only lists limited fields – PID, TTY, TIME, and CMD.
The pstree Command (Processes as a Tree)
Just like the ps command, we have another command named pstree. Unlike the ps command, which simply shows the process, the pstree command displays the hierarchical structure in the tree format.
For example, to get a clear understanding of the pstree command, we will simply execute it without any parameter:
pstree
The output is displayed immediately. Let’s scroll to the top to view the output from the beginning.
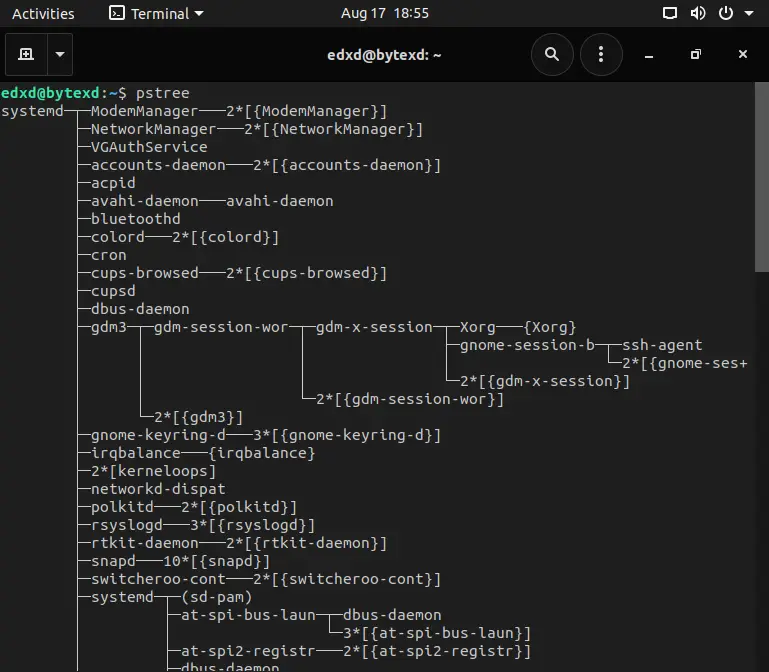
Notice that we have a top-level process in the output, which is at the root of the entire process tree. Every single command is branching out of this process.
How to Use the pstree Command
Another important point to notice is that it merges the identical branches of processes with the square brackets. For example, let’s look at the first branch, which is ModemManager. It is displayed in the following manner:
ModemManager---2*[{ModemManager}]The number before ModemManager is the number of branches that have been merged. We can display the output without the merging of identical branches with the use of the -c parameter. When we use the -c parameter, even the identical branches are displayed, and the number no longer appears. Let’s verify this with the following command:
pstree -c
To view the output, we scroll to the start of the command.
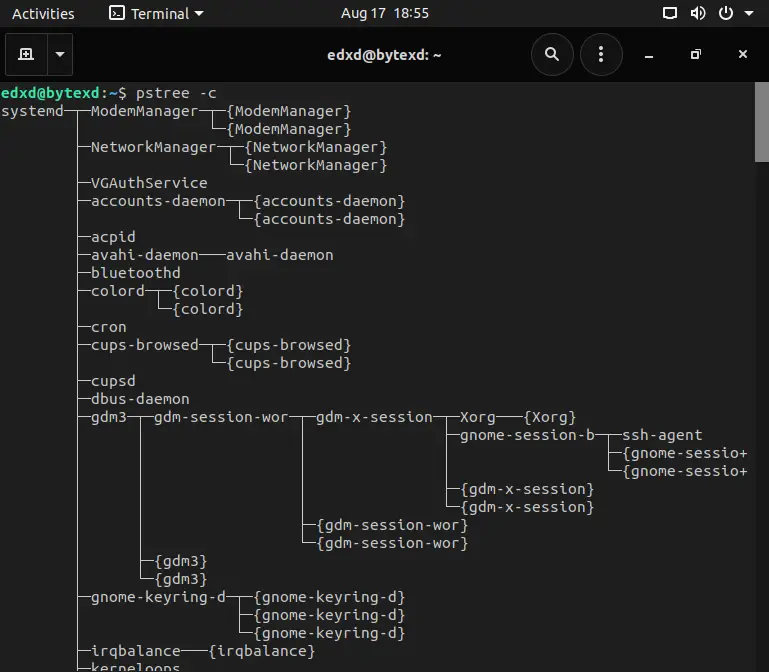
Notice that the number no longer appears. Instead, we have two branches of ModemManager. The name of the process is displayed in the curly brackets.
Show Threads for Each Process (pstree -t)
Let’s now look at the threads of each process.
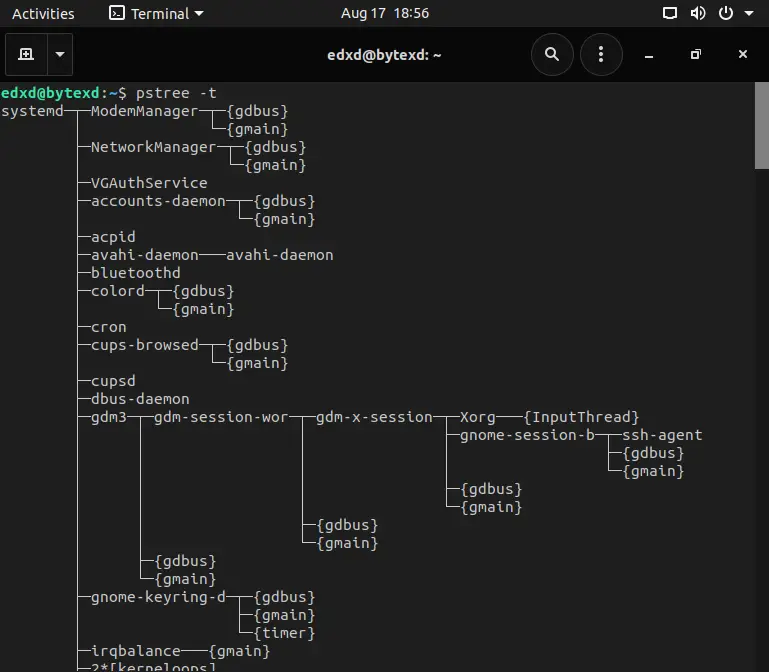
We can display the complete thread names for each process. To do this, we need to use the -t parameter. Let’s execute the following command:
pstree -t
The output is displayed instantly. Let’s now scroll to the top and view the ModemManager process. Notice that it has two threads. Each process is listed with its own threads.
Show Only Process Names (pstree -T)
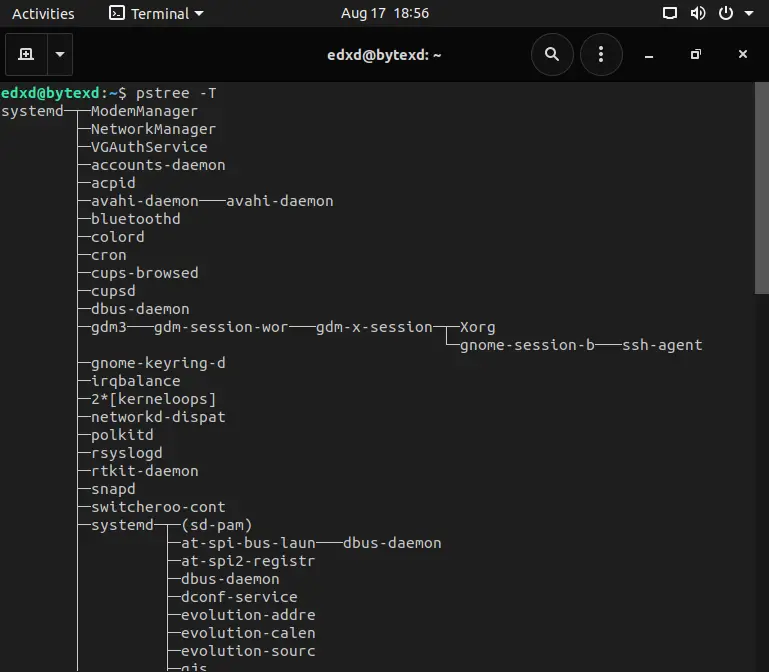
Let’s now assume that we do not want to view the threads but only the process names. To do this, instead of using -t, we can use the -T parameter.
pstree -T
Let’s quickly scroll to the top of the command. Notice that the thread names are no longer listed. It is only the process names.
Show Processes for a Specific User (pstree <USER>)
Let’s now assume that we do not want to see all processes, but only the processes for a specific user.
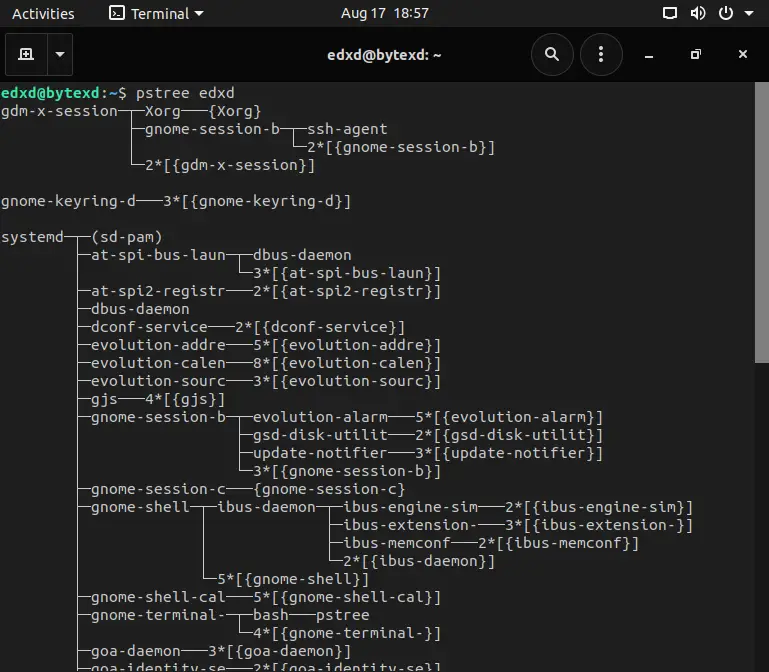
All we need to do is pass the username as an argument to the pstree command. Let’s look at the process tree for the edxd user by using the following command:
pstree edxd
Notice that number of processes from the previous output has reduced to a great extent.
Show Tree for a Single Proceess (pstree <PID>)
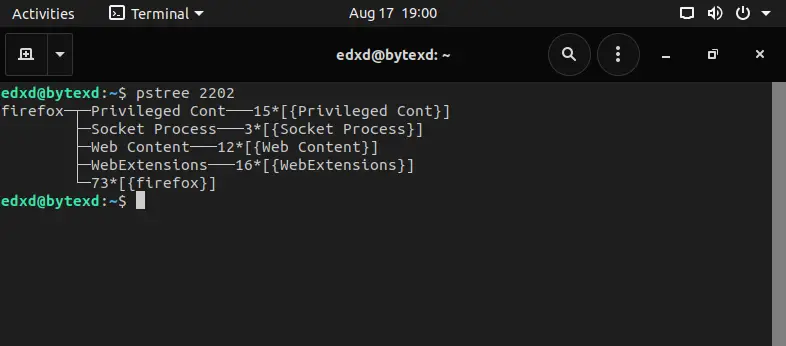
Let’s even generate a smaller tree by passing a PID as an argument to the pstree command.
In my case, I’ll use 2202, which is Firefox:
pstree 2202
The tree is generated only for the mentioned PID of a process.
Show Parent Process Tree (pstree -s <PID>)
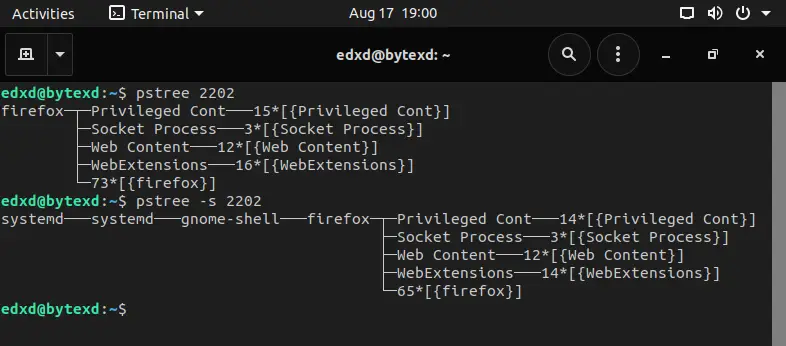
We may require to find the parent process for a given process.
To do this, we need to use the -s parameter with the PID as an argument:
pstree -s 2202
Notice that the parent processes are displayed for the given PID.
Show Process Tree with PIDs (pstree -p)
Did you notice that nowhere are PIDs displayed? What if we need to kill a specific process? We can use its PID, which is rather an easy way to do it.
However, pstree does not display the PIDs by default.
Two ways we can solve this are:
- Run the ps command and find the PID
- Use the -p parameter with the pstree command to find the PID
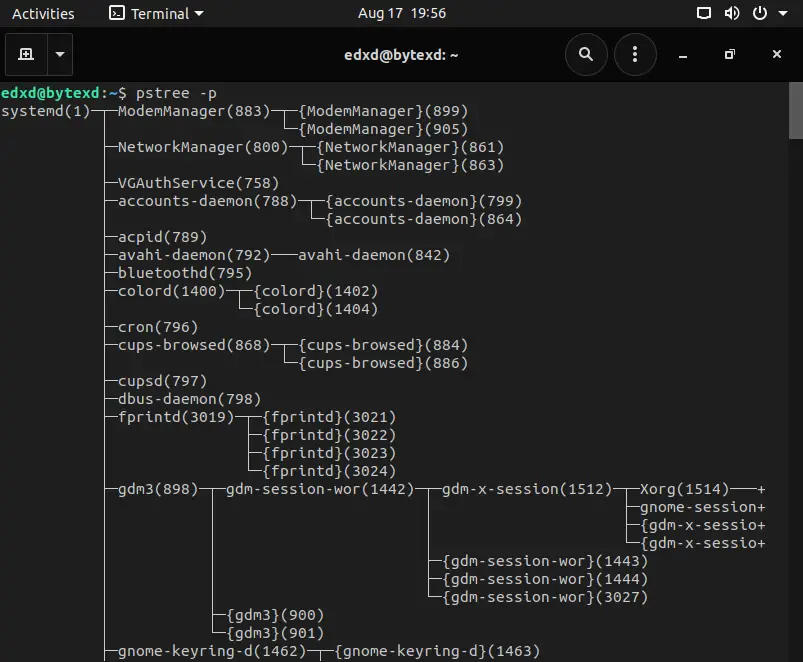
The second method is rather easy to use because you can use the -p option without switching between the ps and pstree commands. So, let’s use the -p parameter:
pstree -p
In the output, notice that each process has a number in parentheses. This number is the PID.
Show Process Tree for Process Name (pstree -p | grep <process_name>)
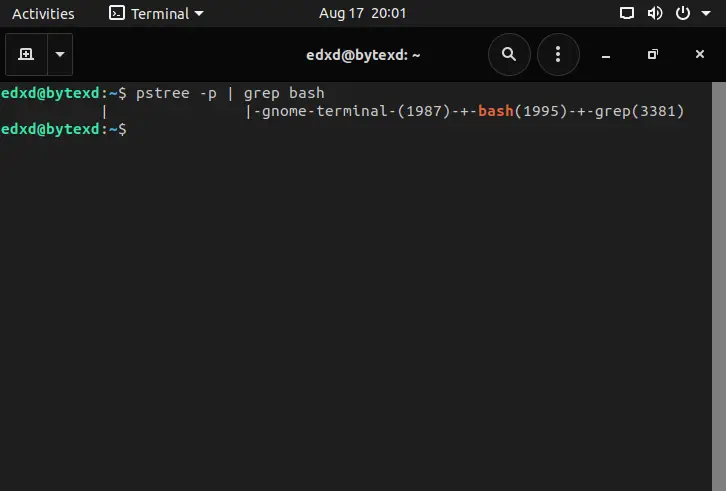
What if you want to narrow down this output to a specific PID or process name, such as bash?
To do this we can simply run pstree -p and direct the output to the grep command to fetch the information only for the bash process. Everything in the output is filtered, and only information for the bash process is displayed.
pstree -p | grep bash
The top Command (Real-Time Process Monitor)
Unlike the ps command, which displays the static status of processes running on a system, the top command dynamically monitors each process.
It displays the system resource utilization of each process and dynamically updates it at a specific interval.
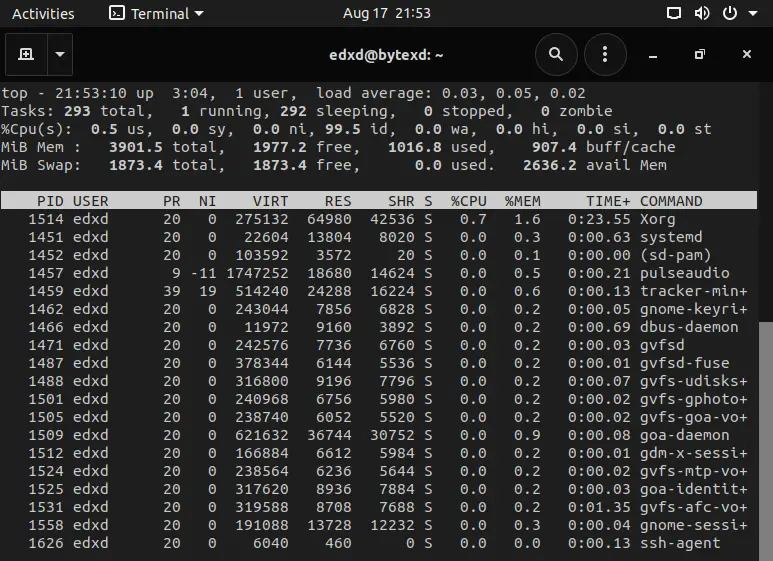
We can simply execute the top command without any argument.
top
When executing this command, the output is generated in a tabular format.
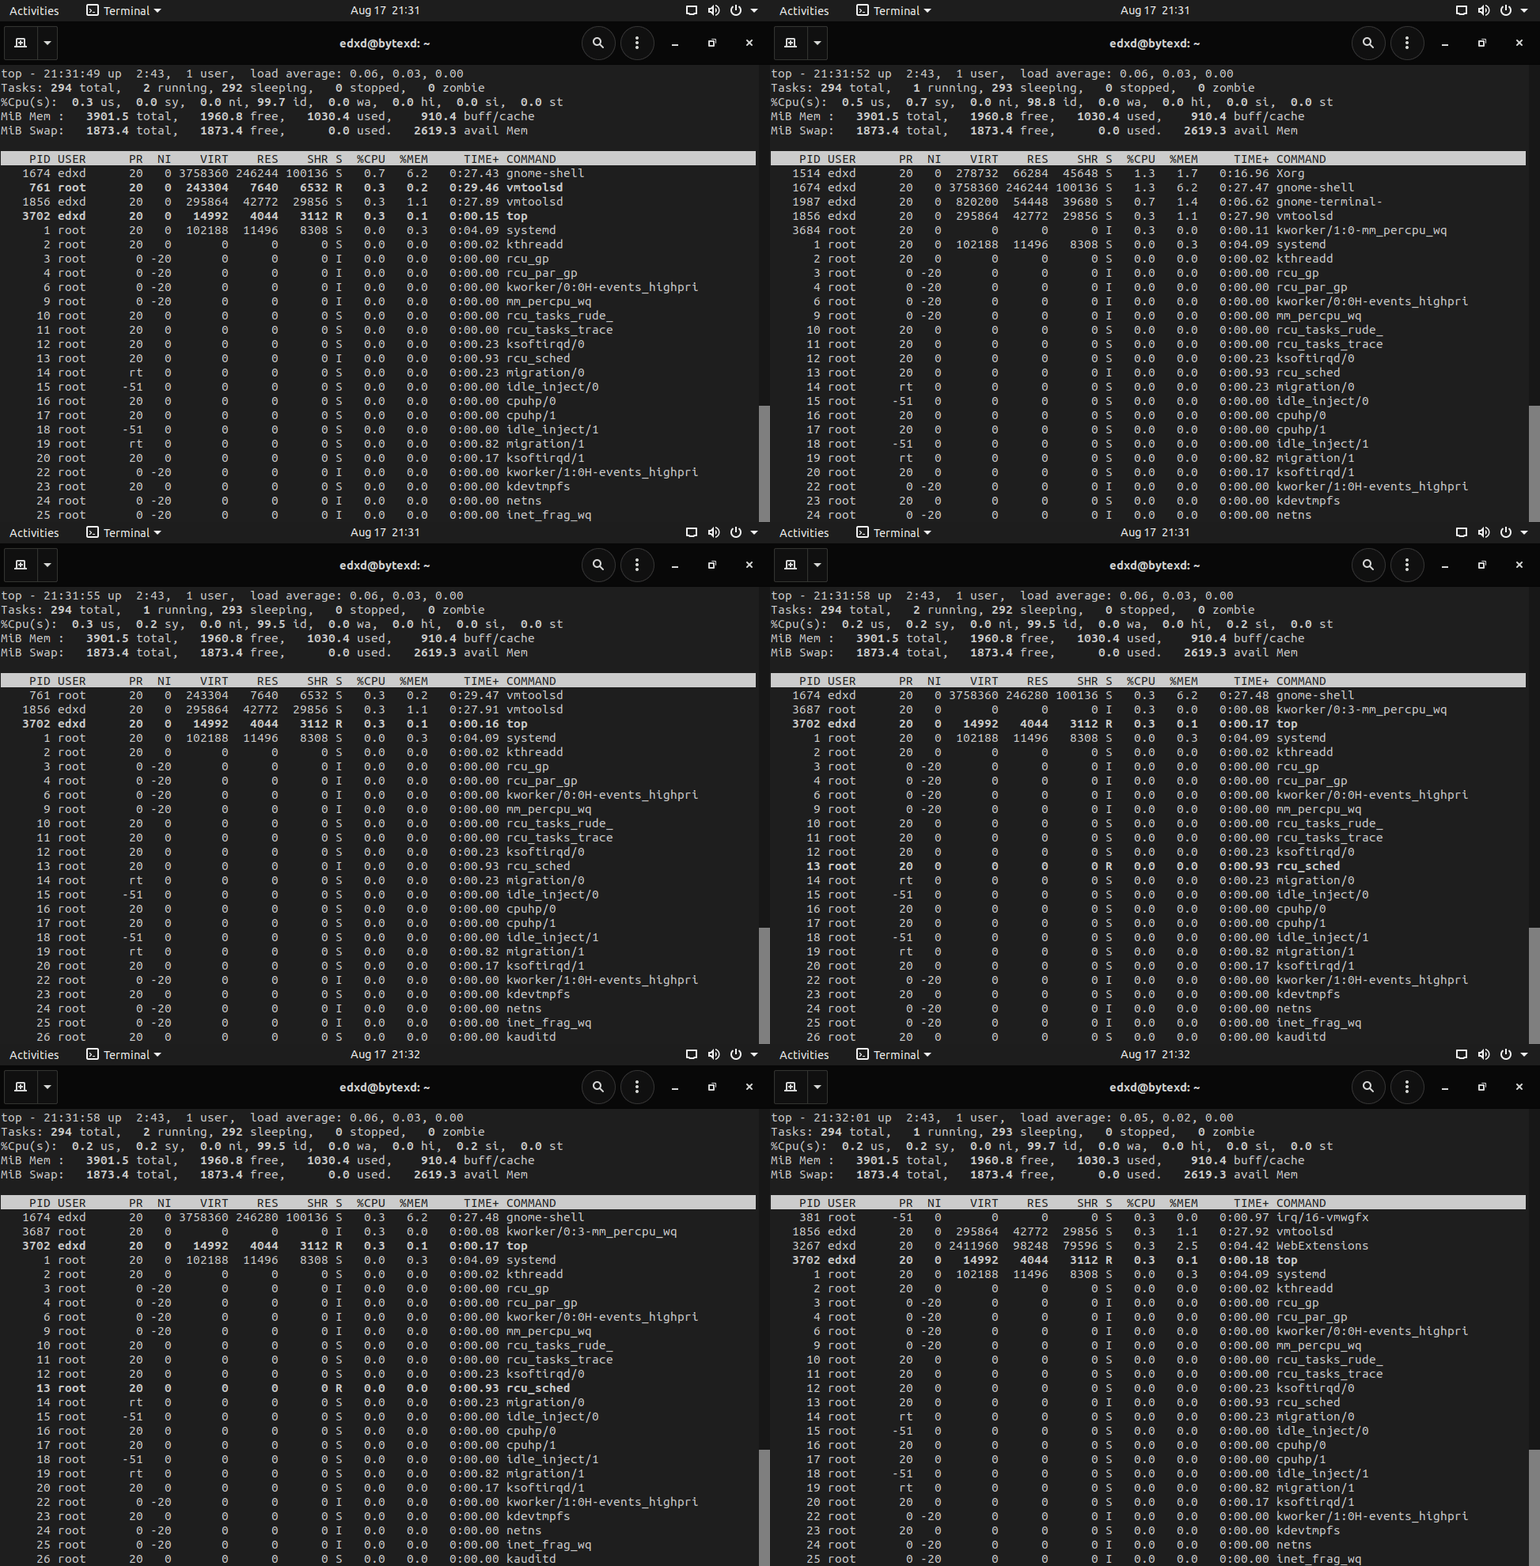
It is important to note that the output of the top command does not require a manual refresh. It is automatically updated after every three seconds. If you notice the output in the exhibit above, it is broken into two parts:
- The first part displays the resource status of the entire system. This information becomes handy when you want to check the system’s health.
- The second part, displayed in a tabular format, displays the status of each process along with its resource utilization.
Understanding the top Command System Values and Column Headers
Let’s look at the column headers in the given table, which is the second part of the output:
- PID: is the ID of the process that is currently running.
- USER: is the username who owns the process
- PR: displays the process priority. Smaller the number, the higher the priority.
- NI: is the nice value, which is also the priority of the process. Smaller the number, the higher the priority.
- VIRT: is the amount of virtual memory consumed by the process.
- RES: is the amount of physical memory consumed by the process.
- SHR: is the size of the shared memory.
- S: displays the process status.
- %CPU: is the percentage of CPU used by the process.
- %MEM: is the percentage of memory used by the process.
- TIME+: is the total CPU time used by the process.
- COMMAND: is the name of the process.
The top part displays several values, which are:
- Current system time
- Total running time of the system
- Number of users logged in
- The average load of the system
- Total number of processes
- Number of running processes
- Number of sleeping processes
- Number of stopped processes
- Number of zombie processes
- Percentage of CPU used by user mode
- Percentage of CPU used by system mode
- Percentage of CPU used by user processes
- Percentage of CPU used by idle CPU
- Percentage of CPU used by processes waiting for input and output
- Percentage of CPU used by hard interrupt request service
- Percentage of CPU used by soft interrupt request service
- Percentage of virtual time
- The total amount of physical memory
- The total amount of used physical memory
- Total free physical memory
- The total size of swap partition or virtual memory
- Size of the used swap partition
- Size of the free swap partition
- Size of the swap partition as a cache
How to Use the top Command
We had triggered the top command, and we must remember that the top command since it is generating dynamic output, continues to run unless interrupted manually.
The information is updated every three seconds. Now, we can terminate this command by pressing the q key.
q
The moment we press the q key, the top is terminated, and we are back on the terminal prompt.
Let’s assume that we want to let the top command run but terminate a single process.
Kill Processes With top
To do this, we need to kill the process. We can use the k parameter, which need not be typed, but we need to press the k key on the keyboard.
When we press the k key, notice that just above the column headers, you get an extra statement, which is:
PID to signal/kill [default pid = 1674]
Here, we are required to enter a PID for the process that we want to kill.
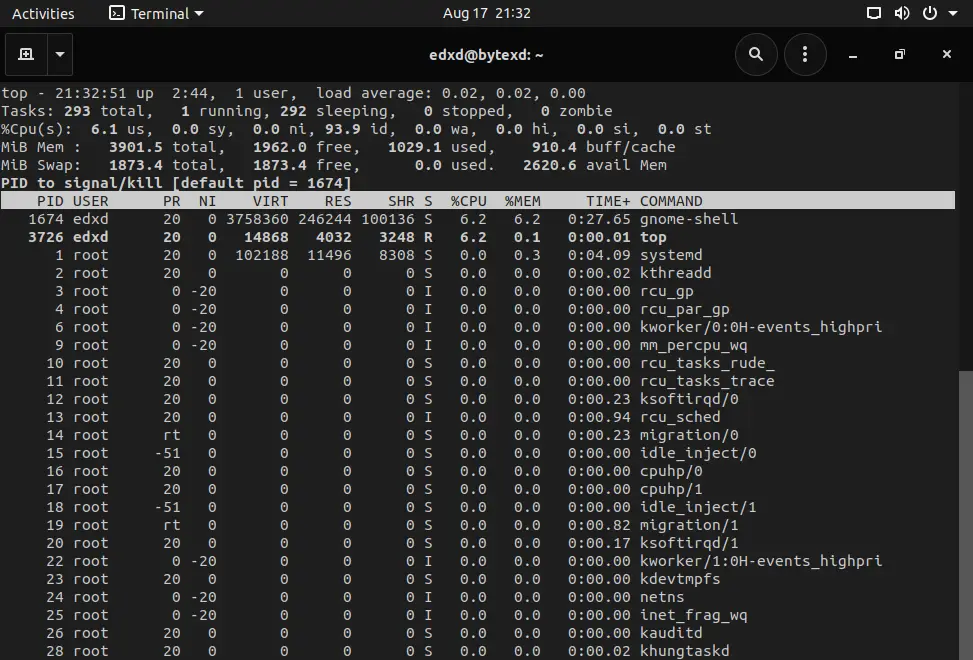
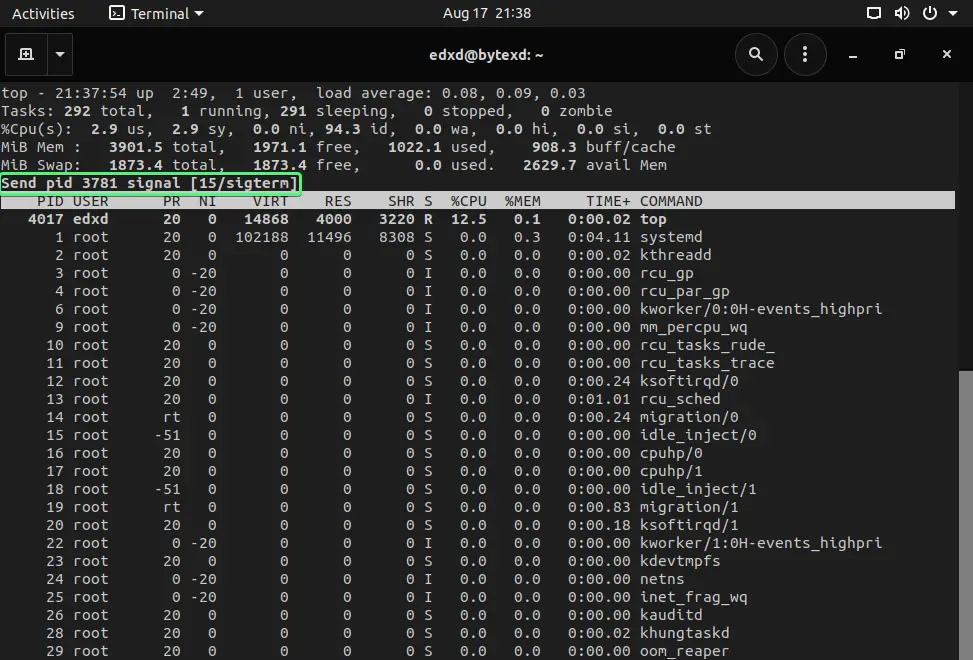
I’ll enter the PID as 3781, which is Firefox in my case. Remember that every time the PID will differ.
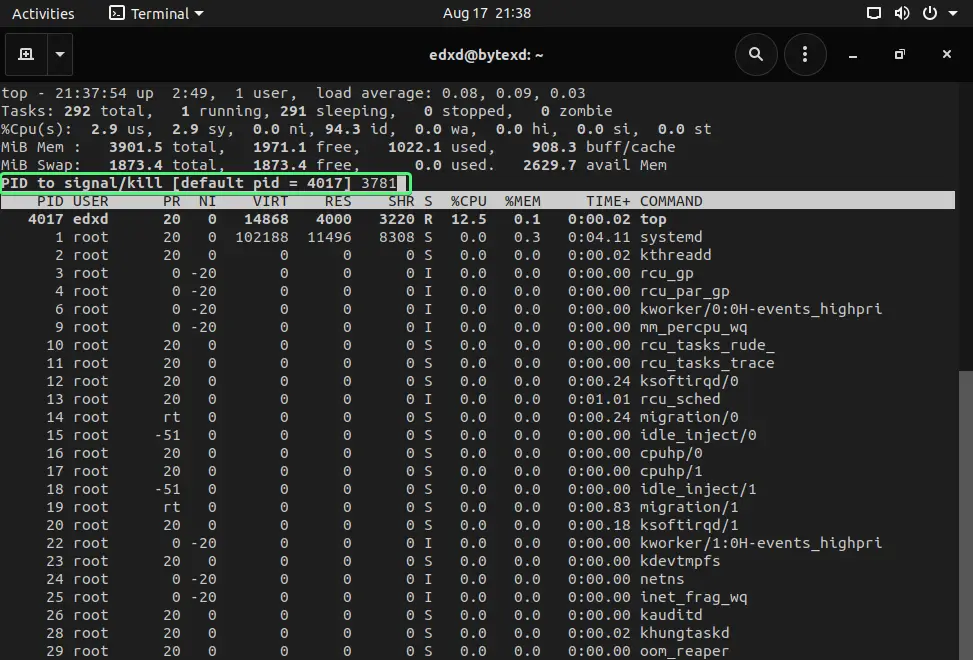
After we enter the PID and press Enter, we are prompted to confirm, which we can do by simply pressing Enter once again.
Run top For Specific Process (top -p <PID>)
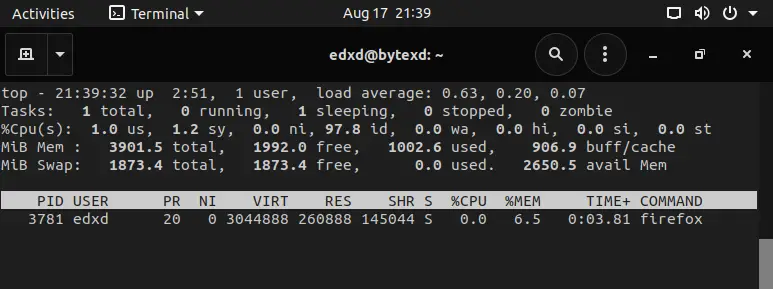
We can run the top command for a specific process. To do this, we need to use the -p parameter and the PID of the process.
top -p 3781
The top command will display only the mentioned PID.
Automatically Close top After n Refreshes (top -n <refresh_number>)
We earlier stated that the top command would continue to run unless stopped manually.
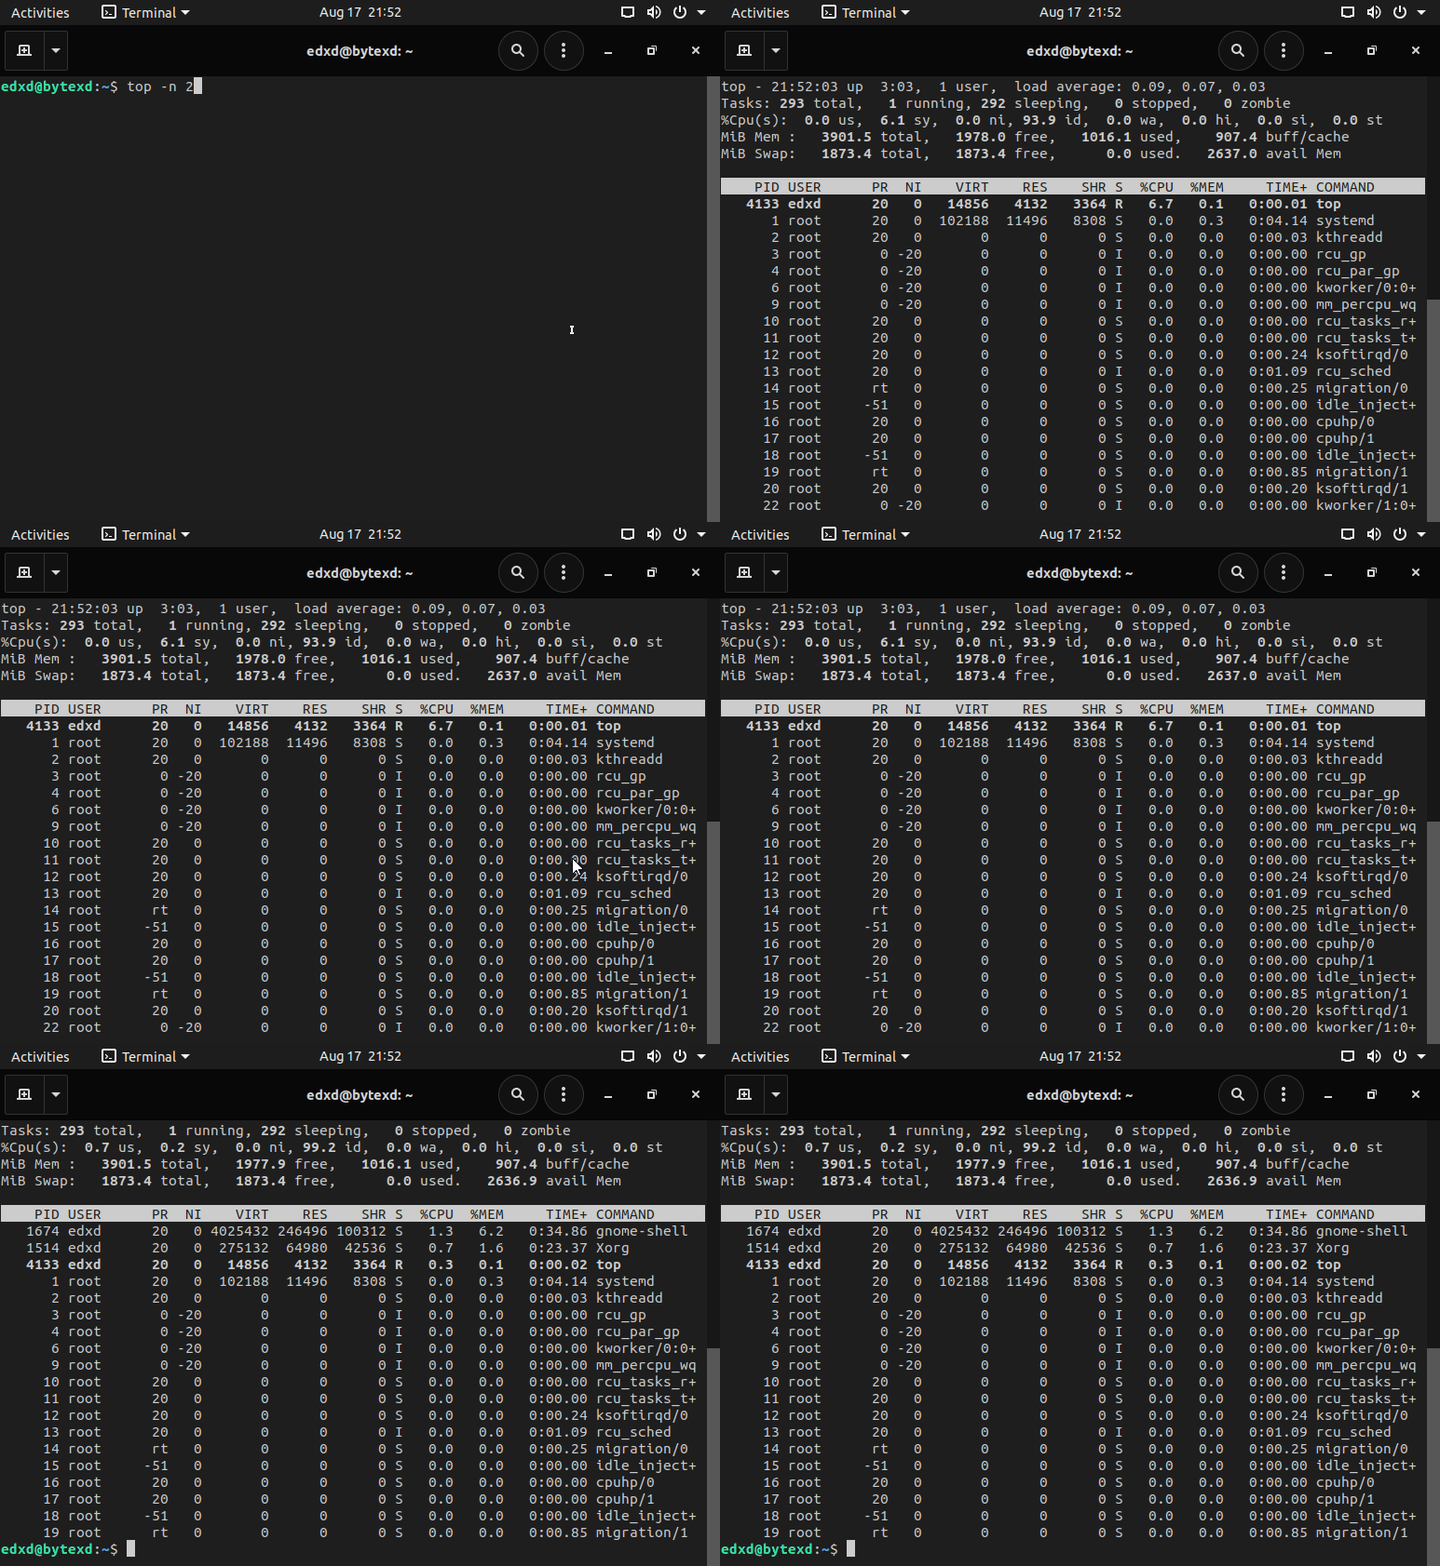
We can also make it run only for a limited number of refreshes, which by default occurs after every three seconds.
To do this, we need to use the -n parameter in the following manner:
top -n 5
The number along with the -n parameter defines the number of refreshes. After the mentioned number of refreshes is over, the top command stops automatically.
Run top For Specific Users (top -u <USER>)
We can even display the processes specific to a user, such as edxd, with the -u parameter’s help.
To do this, we need to execute the following command:
top -u edxd
Notice that the processes are listed only for edxd.
Display Absolute Paths for Processes (top -c)
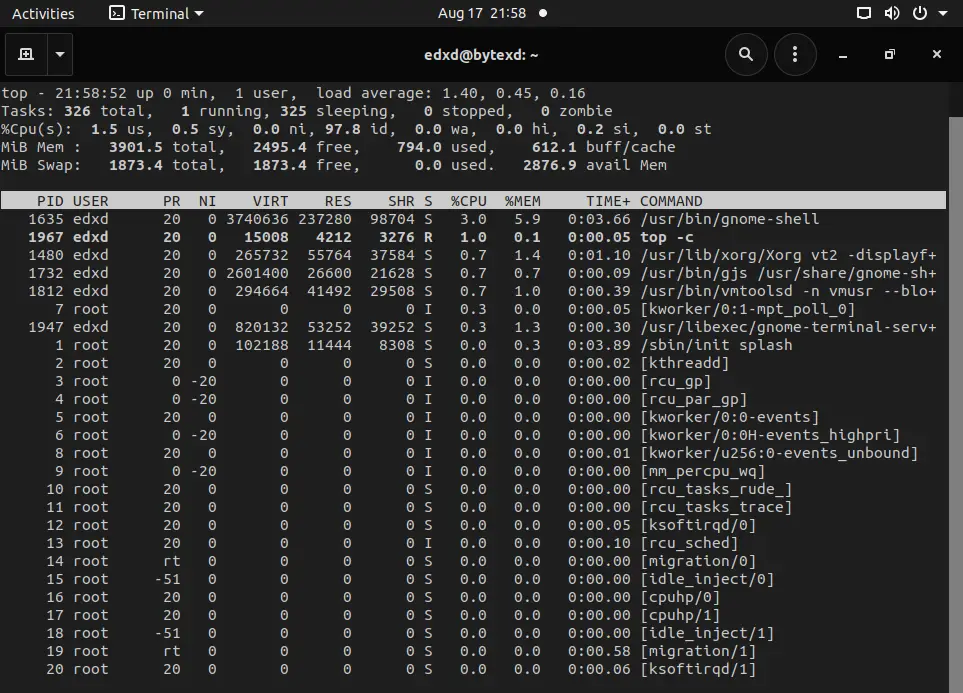
We can even display the absolute path of the process with the -c parameter. Run the following command:
top -c
Notice that several processes now display the absolute path. An important point to note is that you can simply run the top command and then press c to get the same output.
Change Refresh Interval (top -d <seconds>)
As stated earlier, the default refresh for the top command is three seconds. However, we can change the refresh interval with the use of the -d parameter.
To do this we can run:
top -d <seconds>
For example, we can refresh every 1 second:
top -d 1
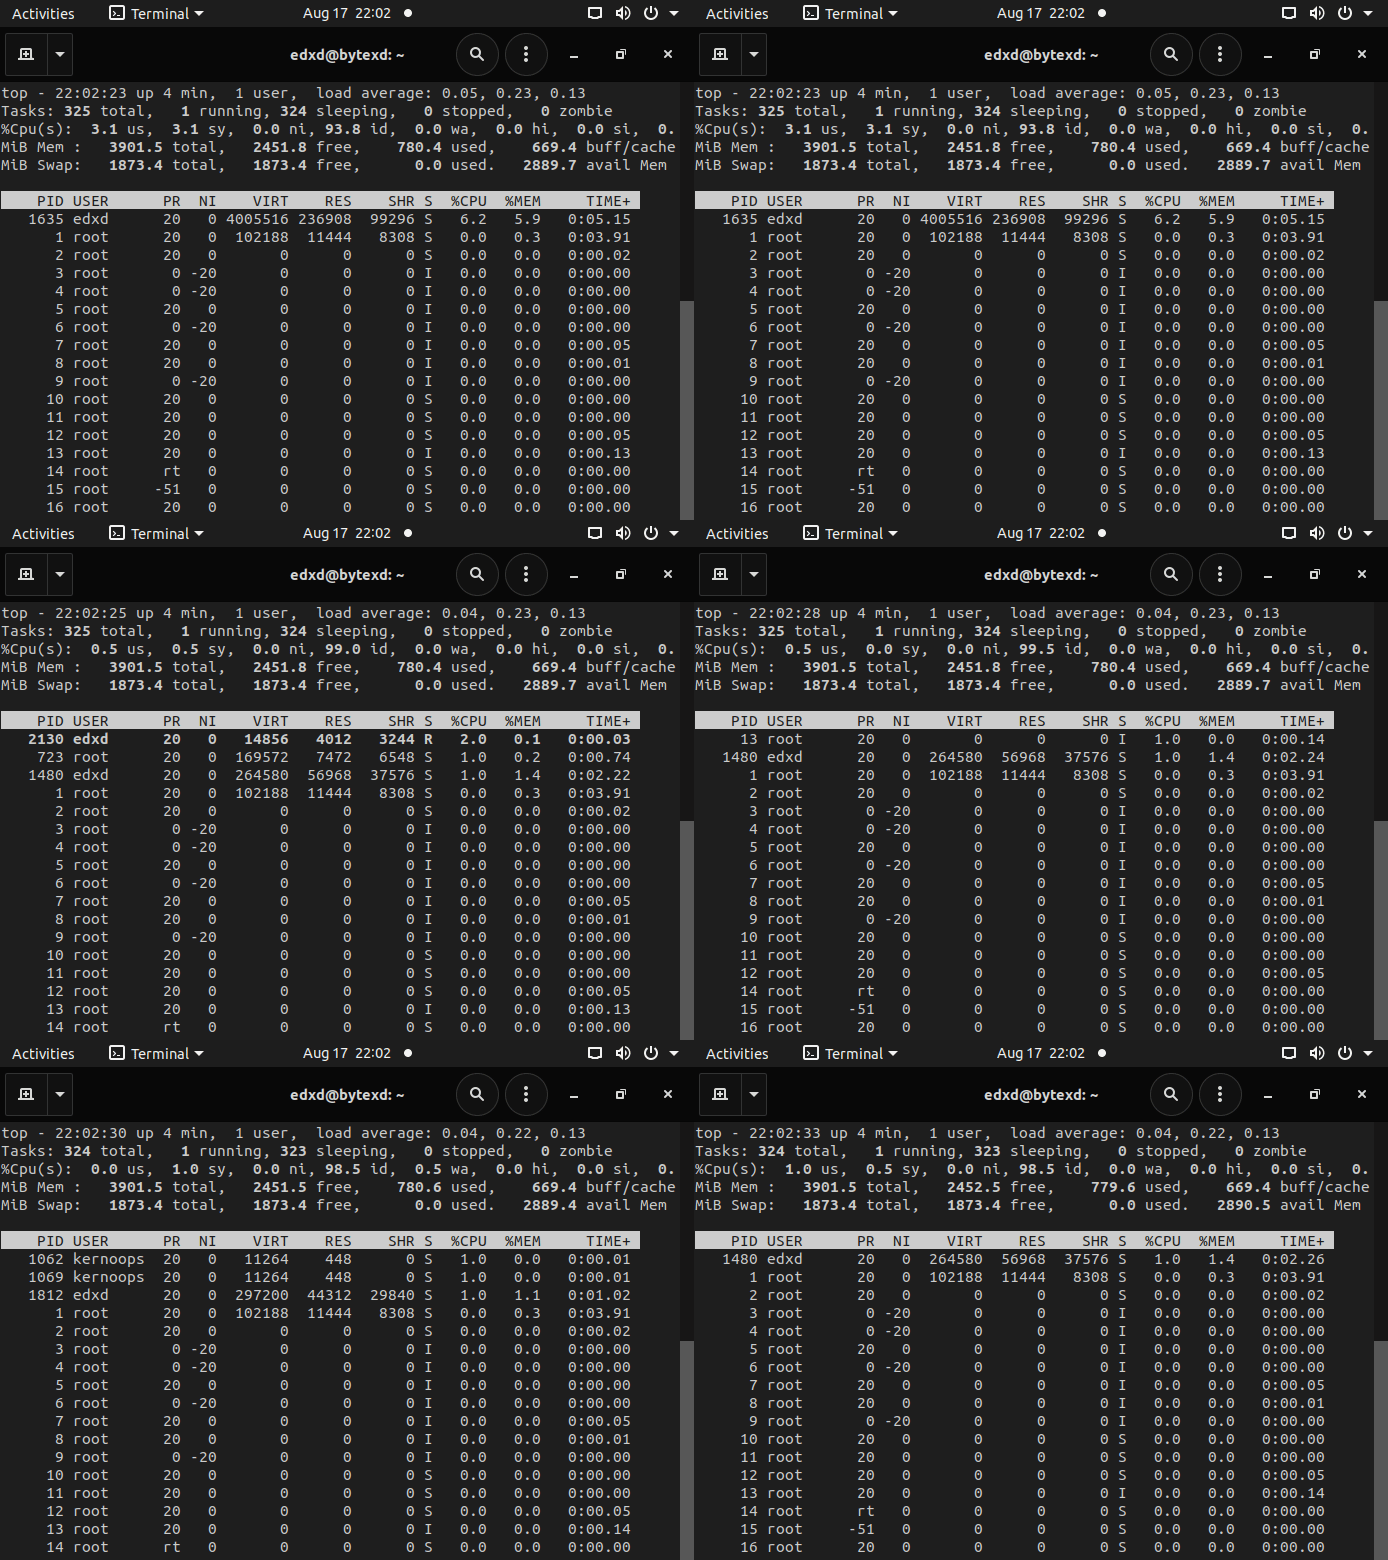
In this command, we are changing the refresh interval to 1 second. This means that the output will be refreshed every 1 second instead of 3 seconds.
Conclusion
Well done. Hopefully, this tutorial helped us understand the use of the process monitoring commands in Ubuntu 20.x. If we encountered any issues, please feel free to leave a comment or contact us, and we’ll get back to we as soon as we can.


