Sometimes, due to the high utilization of resources, system applications get slow or unresponsive. All the programs must share the finite resources of the CPU, and some processes use more of it than others.
In this case, the rest of the pending requests must wait until the CPU is free or available for processing.
As a Linux system administrator, you can find out how much CPU is consumed by each process.
Objectives
The main objective of this tutorial is to explore some useful commands that help you identify the CPU usage on Linux systems. We will show 8 different Linux commands through which you can quickly determine how much CPU is being used by each process.
Moreover, we will also present how to execute these Linux commands on Ubuntu/Debian Linux distributions.
top – Dynamic real-time process statistics
The top program is a command-line utility installed by default on almost all Linux operating systems. It provides the dynamic real-time summary of all currently running tasks that are managed by the Linux kernel.
It monitors the complete utilization of process, CPU, and memory on your Linux system. Using the below-given command, you can run the top utility on a Linux system:
top
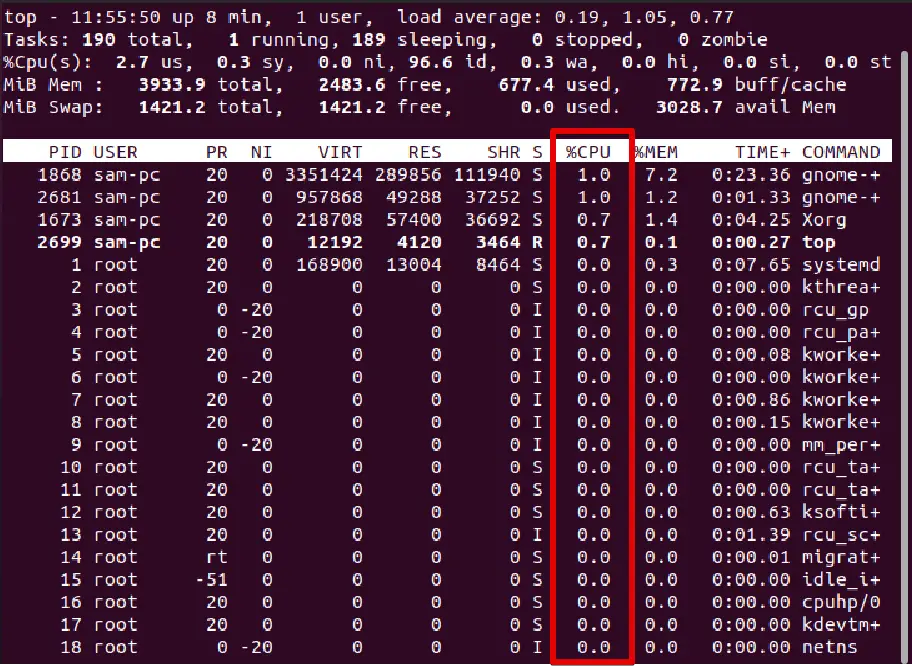
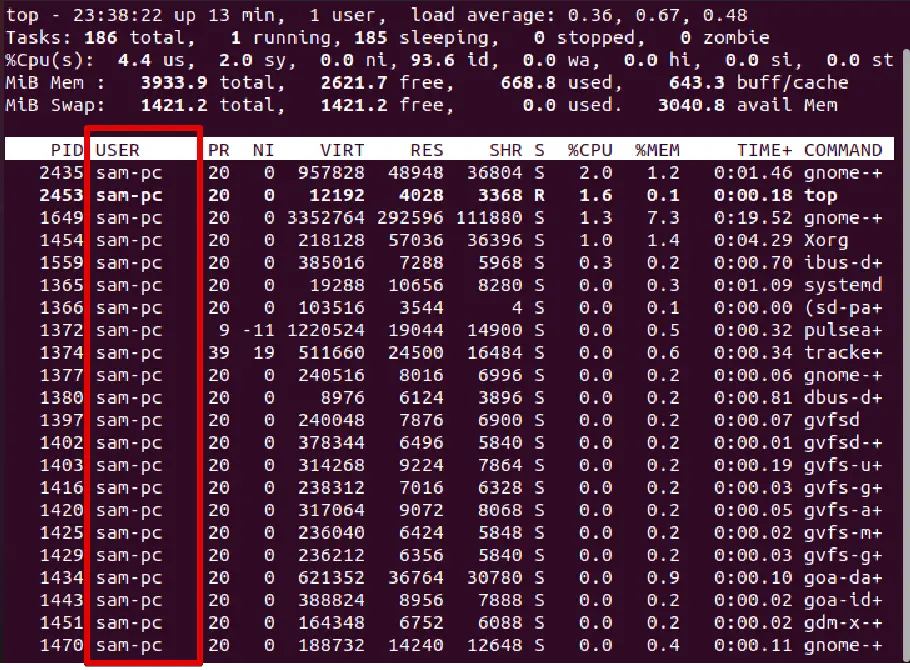
As you can see in the output mentioned above, the top header section displays the system’s overall status information, such as uptime, load average, total process counts, current CPU utilization status, and usage of memory and swap space. The process list is sorted by the percentage of CPU utilization.
Here are sometop command usage examples:
You can display a specific user process using the top command as follows:
top -u sam-pc
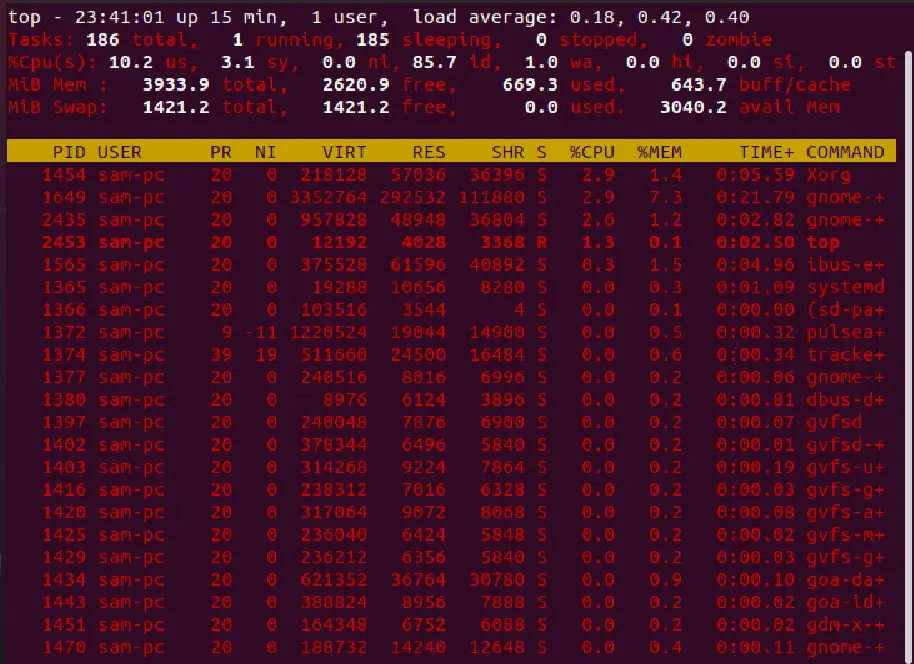
When you use the top command, you can highlight the running processes by pressing z.
htop – More system details than top
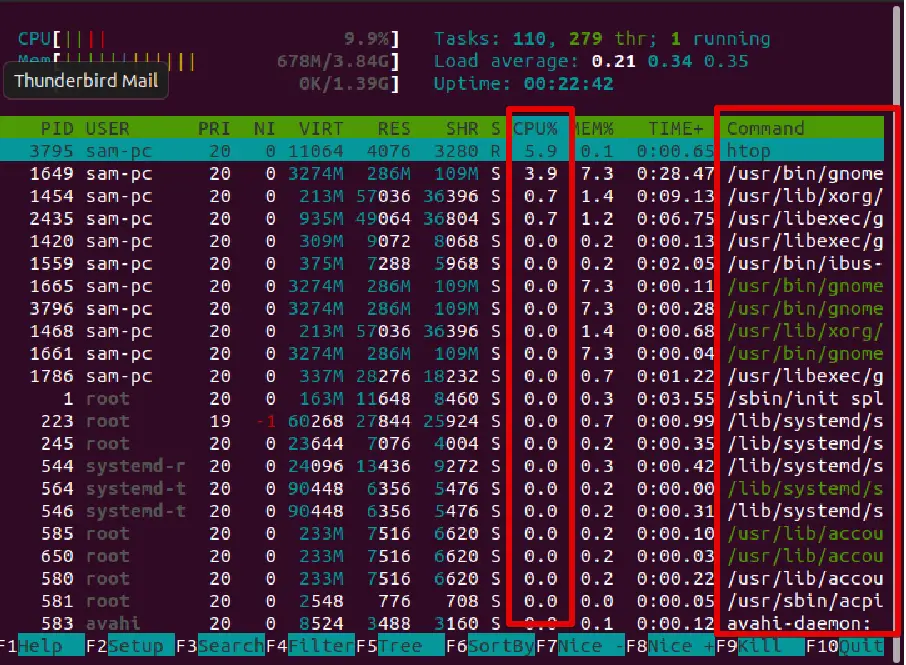
The htop is also a command-line utility that is similar totop. It gives a detailed summary of the CPU and system resource utilization.
You can either scroll vertically, horizontally to display more details. It also provides you with the process path under the command column.
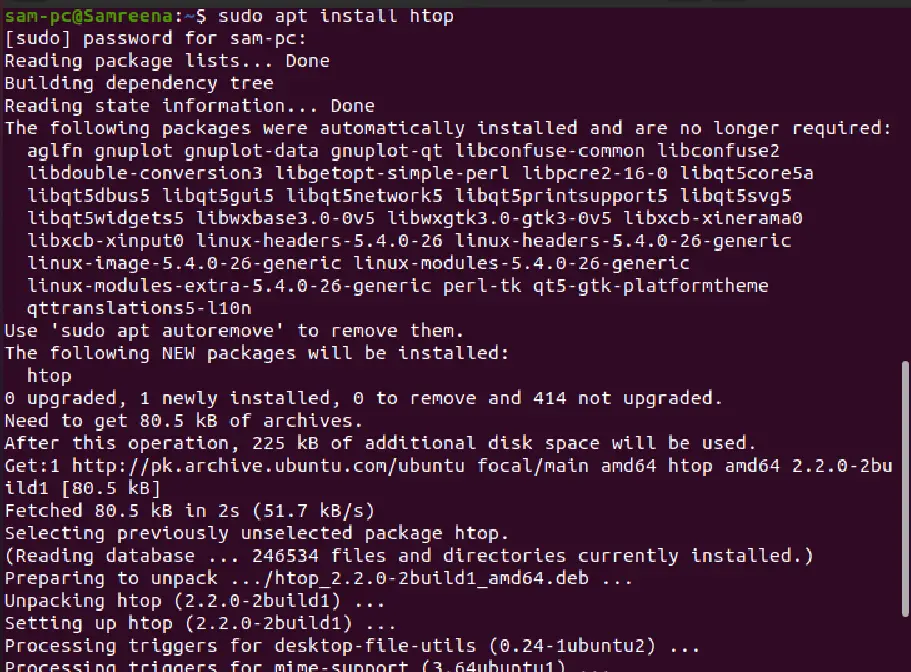
The htop command-line tool is not installed on Linux by default. However, you need to install the htop utility on your system by typing the command:
sudo apt install htop
To monitor CPU usage and other system resources use the htop in the following way:
htop
ps – CPU and memory utilization information
The ps command is useful to determine which process is hogging the CPU. When the ps command is used with the process id (PID), it displays the CPU and memory utilization information.
To run the ps command on a Linux system, use the following syntax:
ps -p $PID -o %cpu,%mem

nmon – Nigel’s performance Monitor for Linux
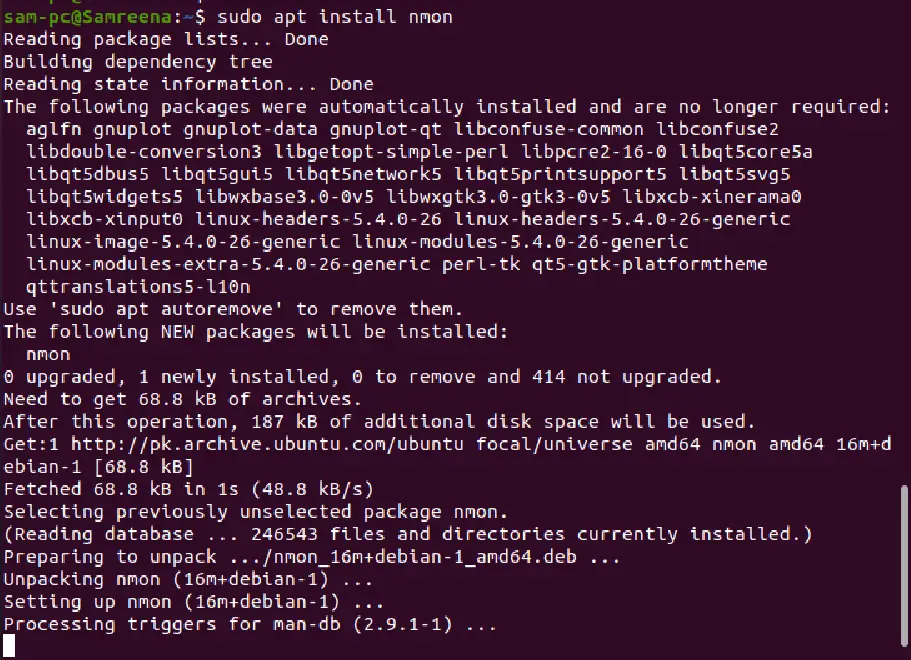
The nmon is an interactive command-line tool that monitors the CPU, disks, NFS, memory, and network utilization. Use the nmon command and then press t to view a process that utilizes more resources. This monitoring command-line tool can install by running the following command on your Ubuntu / Debian system:
sudo apt install nmon
nmon
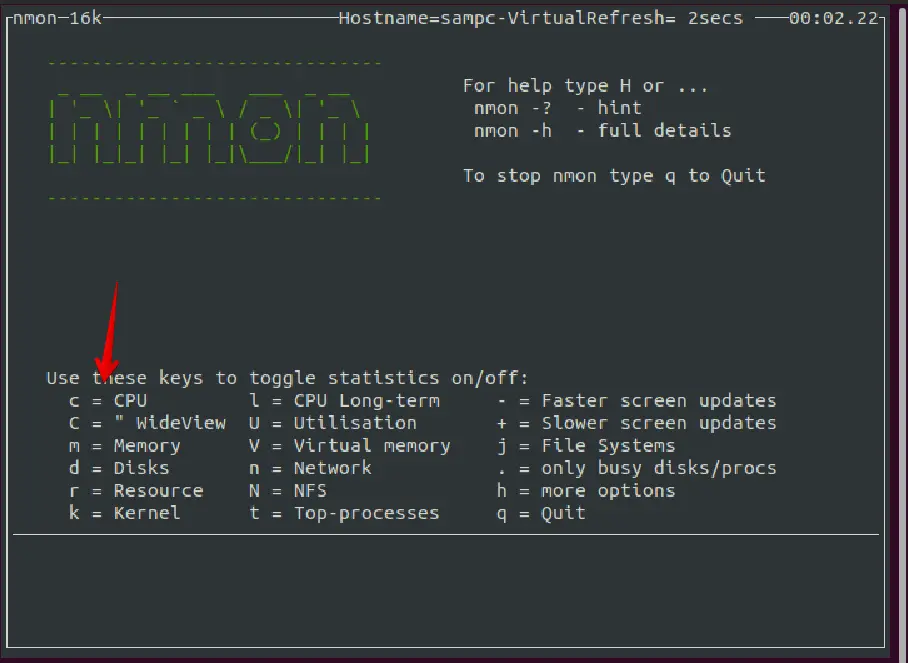
Press cto view the CPU utilization menu as follows:

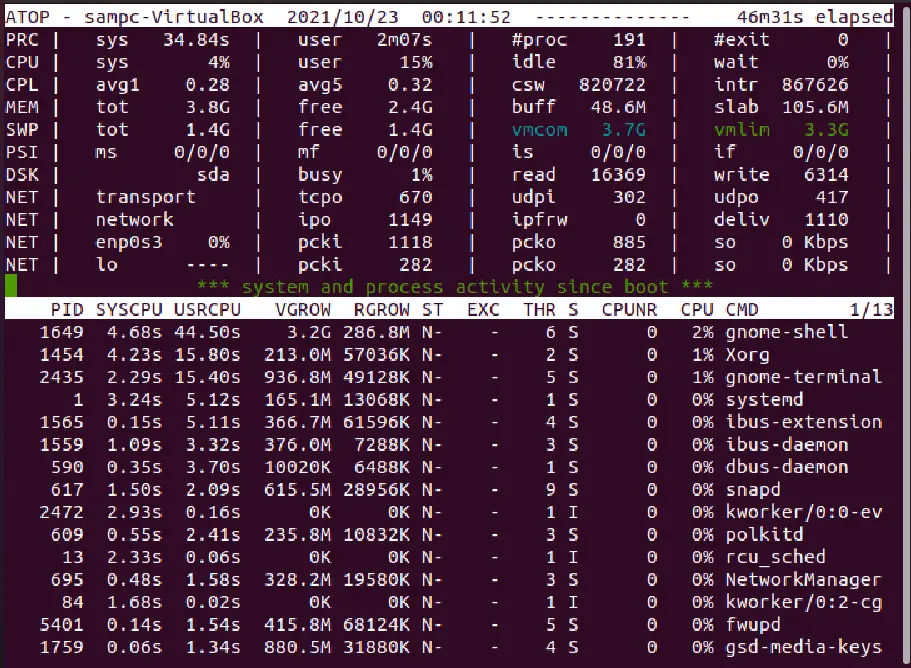
atop – Records the resource utilization in a file to be viewed later
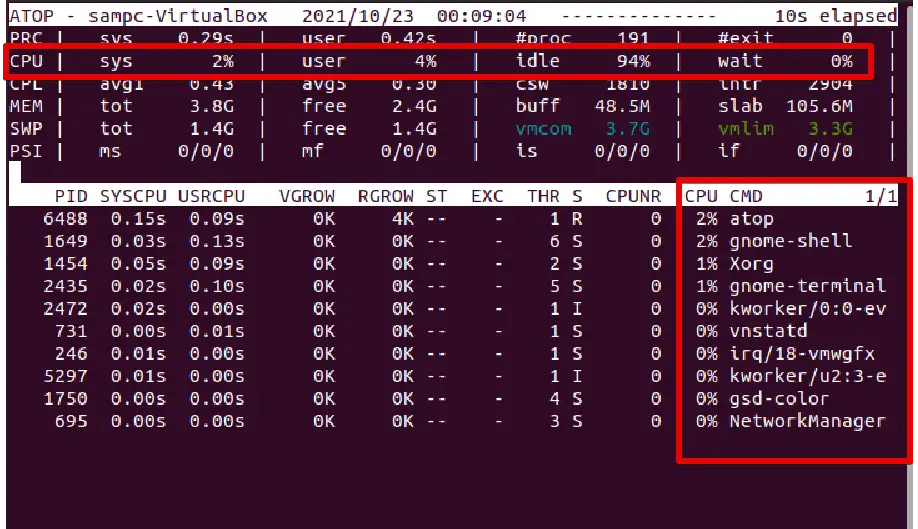
The atop command-line utility records the output in a file to view later. It performs a similar function to the previous commands.
It also helps in real-time troubleshooting by typing the following command:
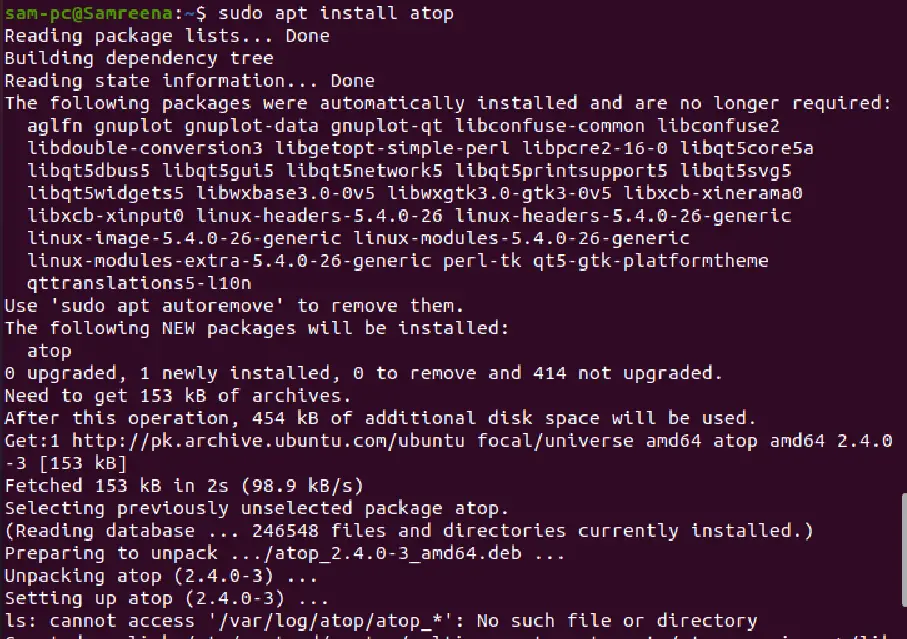
sudo apt install atop
atop
Use the following command to install atop utility on Ubuntu / Debian system:
To record the output in a file use the following syntax:
atop -w filename
To view the recorded output, use the following command:
atop -r filename
glances – Displays system resource utilization on a single screen
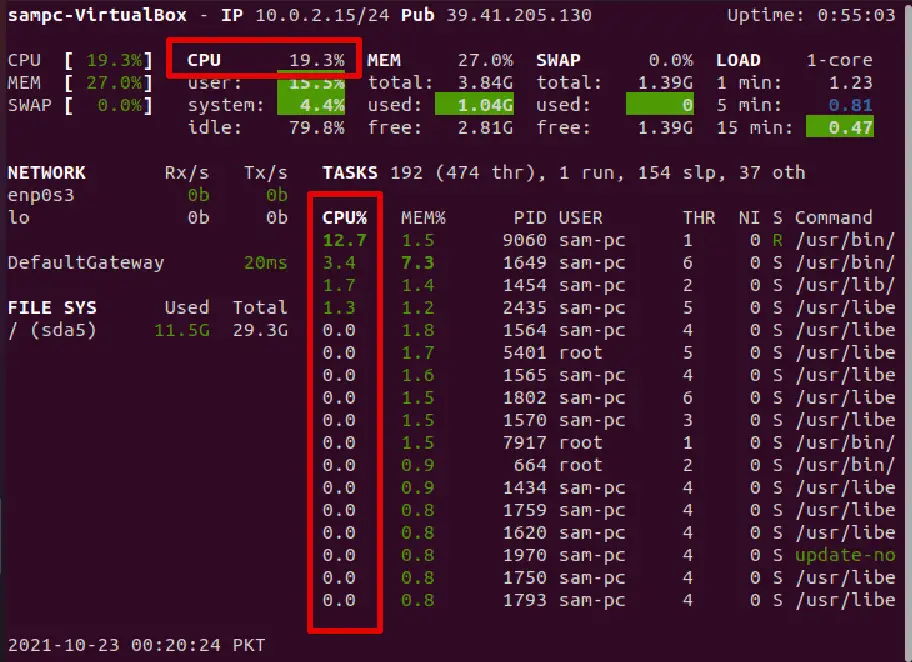
Glances is a useful monitoring tool used for monitoring the system status. This tool is written in python and uses a library psutil for displaying the various system resource information in detail such as CPU usage, memory, and network monitoring, processes, disk I/O, and file system utilization, etc.
Run the command to install glances on Ubuntu:
sudo apt install glances
To run the glances in a standalone mode, use the command:
glances
You can also run glances in web server mode by using the following command:
glances -w

vmstat – Displays information about CPU activities and other resource utilization
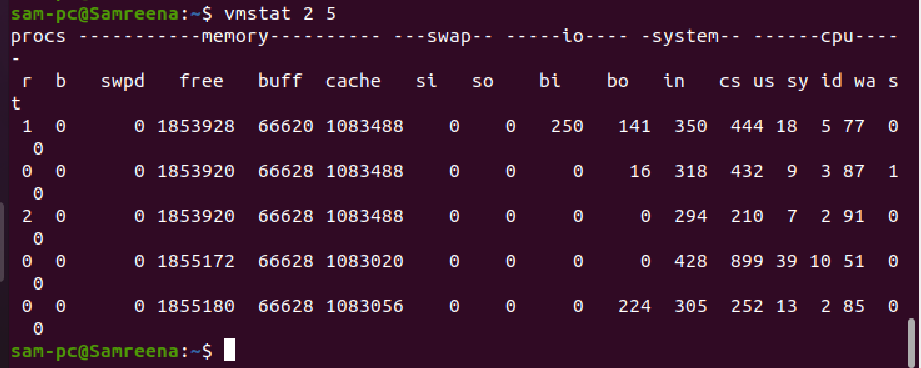
vmstat is a command-line utility that prints the details about CPU activities, processes, traps, block IO, disks, and paging. Use the following command:
vmstat

For example, you want to monitor the system resources using the vmstat command with a 2 seconds interval five times. Use the following command in this case:
vmstat 2 5
sar – Displays a short report of CPU usage
The sar command is used to collect and report the system activity details. This utility displays short details in the form of a report about CPU usage.
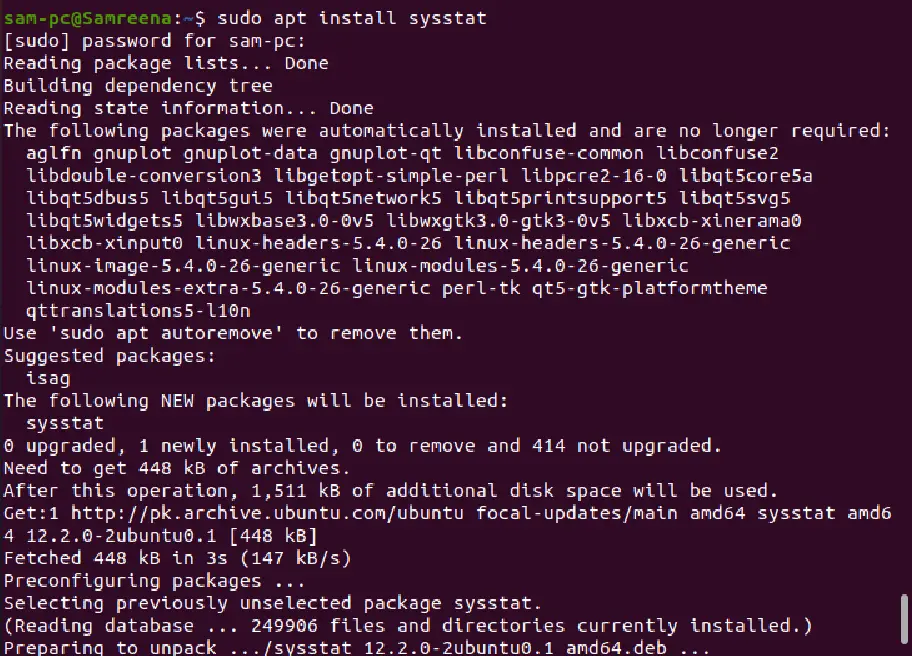
Using the sar command, you can monitor the CPU usage at a certain interval as follows:
sudo apt install sysstat
sar (interval_second)
sar 3
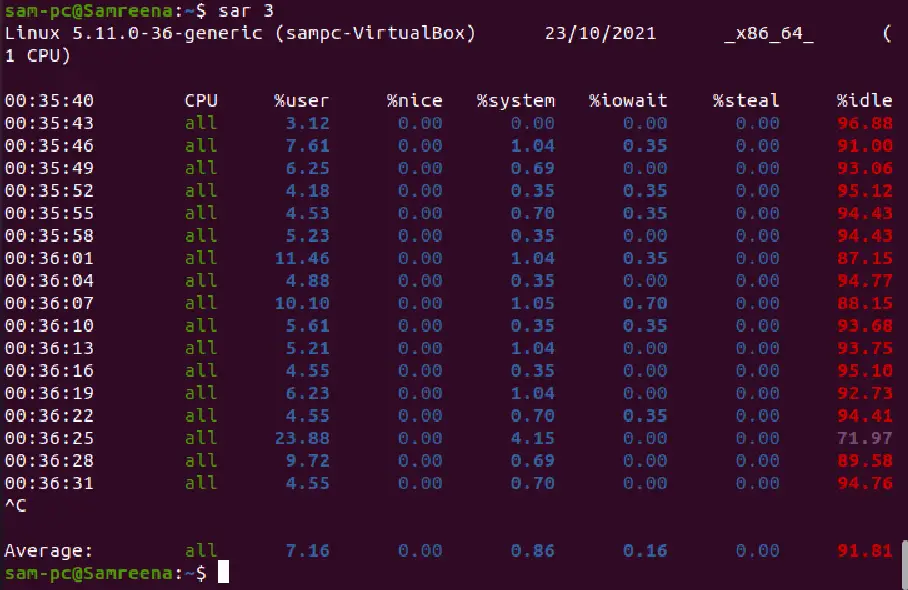
The above example will print the CPU activities after 3 seconds.
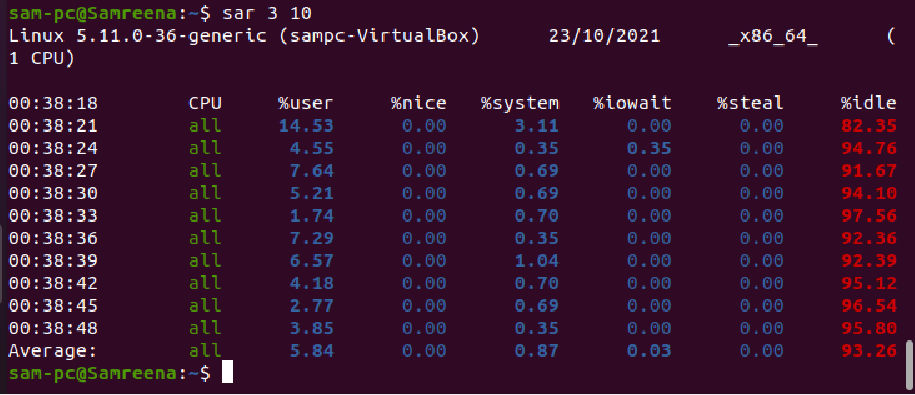
If you want to run a sar command for 10 instances with an interval of 3 seconds then, use the below-mentioned command:
sar 3 10
Conclusion
There are various tools and commands available on the Linux system to monitor CPU usage and system resource utilization. A few of them we discussed in this article with the help of examples.
