Darkstat is an easy to use, low-resource, cross-platform, web-based network traffic analyzer application. For managing Linux servers, this is a great tool. It can analyze network traffic, calculates statistics concerning usage, and serves these reports over the HTTPS.
This tool has an integrated web server. Darkstat also supports IPv6 protocol and asynchronous DNS resolution. Because of low-resource usage, it can keep running in the background and collect data and then present that data in a comprehensible format in its integrated web server.
In this article we’ll learn how to install Darkstat on Linux, how to set up its basic configuration, how to access it from the Web UI, and how to manage it from the command-line.
Table of Contents
Install Darkstat on Your Linux Computer
Darkstat is available for download in the software repositories of mainstream Linux distributions. Follow one of the methods defined below depending upon which Linux distribution you are using.
For Ubuntu/Debian
To install Darkstat web-based network traffic analyzer, run the following command in the terminal.
sudo apt install darkstat
For RHEL/CentOS/Fedora 22+/Rocky Linux/AlmaLinux
If you are running RHEL/CentOS operating system, you will need to execute the following code to install Darkstat on your system.
sudo dnf install darkstat
Configuring Darkstat
To analyze web traffic using Darkstat we need to configure it. Some basic configurations that we must apply to make use of this tool include but are not limited to: Network Interface, port, and listening IP.
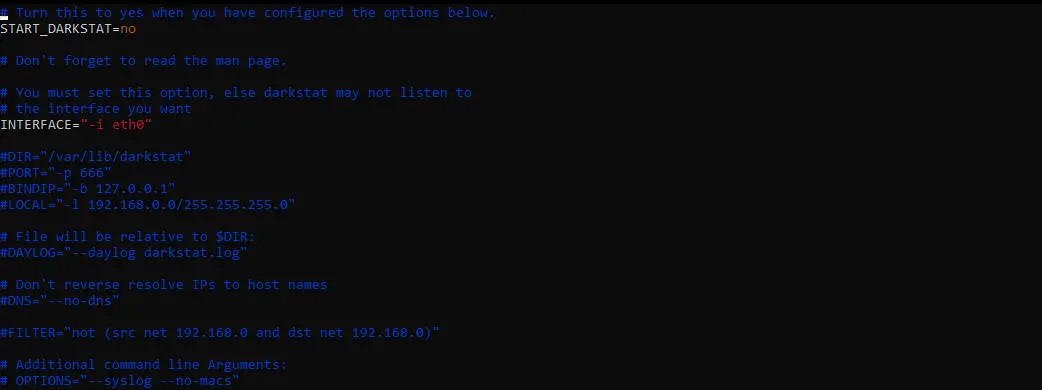
Edit the /etc/darkstat/init.cfg in any editor of your choice that is available. We are going to use nano text editor for this purpose.
nano /etc/darkstat/init.cfg
The above command will return the following window, and you will need to make some changes to it in order to utilize the Darkstat web analyzer.

Change the START_DARKSTAT parameter to yes.
Make sure that you uncomment the DIR, PORT, BINDIP, LOCAL, and DAYLOG parameters. DIR specifies the directory and DAYLOG specifies the log file. BINDIP is used to specify any specific IP you wish to bind the web interface to.
Now the changes should look something like this.
START_DARKSTAT=yes
INTERFACE="-i eth0"
DIR="/var/lib/darkstat"
PORT="-p 666"
BINDIP="-b 127.0.0.1"
DAYLOG="--daylog darkstat.log"
Allow Access to Darkstat from External Machines
localhost).
To allow access to Darkstat from external machines, we need to make a few more changes to the /etc/darkstat/init.cfg file. We need to configure our INTERFACE, BINDIP and to make sure our firewall allows connections on port 666.
First we should find out what network interface your machine is using. The default INTERFACE in the Darkstat config file is eth0. In my case, for example, it needs to change to ens2.
To find out run the following command:
ip addr
As you can see, my interface is ens2:
1: lo: <LOOPBACK,UP,LOWER_UP> mtu 65536 qdisc noqueue state UNKNOWN group default qlen 1000
    link/loopback 00:00:00:00:00:00 brd 00:00:00:00:00:00
    inet 127.0.0.1/8 scope host lo
       valid_lft forever preferred_lft forever
    inet6 ::1/128 scope host
       valid_lft forever preferred_lft forever
2: ens2: <BROADCAST,MULTICAST,UP,LOWER_UP> mtu 1500 qdisc fq_codel state UP group default qlen 1000
    link/ether de:1c:d8:2c:00:02 brd ff:ff:ff:ff:ff:ff
    altname enp0s2
    inet 10.194.170.3/31 metric 100 scope global dynamic ens2
       valid_lft 85867sec preferred_lft 85867sec
    inet6 2001:bc8:610:ff01::1/64 scope global
       valid_lft forever preferred_lft forever
    inet6 fe80::dc1c:d8ff:fe2c:2/64 scope link
       valid_lft forever preferred_lft forever
As for the BINDIP, we can change it to the IP from which we plan to access Darkstat, or 0.0.0.0 if we want to allow connections from any other computer. For this example I’ll change it to 0.0.0.0.
The config file will look like this now:
START_DARKSTAT=yes
INTERFACE="-i ens2"
DIR="/var/lib/darkstat"
PORT="-p 666"
BINDIP="-b 0.0.0.0"
DAYLOG="--daylog darkstat.log"
Configure Firewall to Allow Connections to Darkstat
Lastly, you’ll need to configure your firewall to allow connections to port 666. If you’re using ufw on Ubuntu/Debian-based distros, or Firewalld on RHEL-based distros, you can do the following:
sudo ufw allow 666/tcp
sudo ufw reload
sudo firewall-cmd --zone=public --add-port=666/tcp
sudo firewall-cmd --reload
Starting Darkstat
Once the configuration is complete, you will need to restart Darkstat.
systemctl restart darkstat
The following command can be executed to start the Darkstat network traffic analyzer tool manually.
sudo systemctl start darkstat
We can also enable it to start at system boot, which is also the recommended setting. To do so, execute the following code.
sudo /lib/systemd/systemd-sysv-install enable darkstat
To check the status of the Darkstat tool, run the following command.
systemctl status darkstat
● darkstat.service - LSB: start darkstat monitoring system at boot time
     Loaded: loaded (/etc/init.d/darkstat; generated)
     Active: active (exited) since Fri 2022-08-12 18:12:55 UTC; 18s ago
       Docs: man:systemd-sysv-generator(8)
        CPU: 8ms

Aug 12 18:12:55 darkstat systemd[1]: Starting LSB: start darkstat monitoring system at boot time...
Aug 12 18:12:55 darkstat darkstat[24056]:  * Starting darkstat network daemon : darkstat
Aug 12 18:12:55 darkstat darkstat[24056]:  * done
Aug 12 18:12:55 darkstat darkstat[24056]:    ...done.
Aug 12 18:12:55 darkstat systemd[1]: Started LSB: start darkstat monitoring system at boot time.
Access Darkstat via Web UI
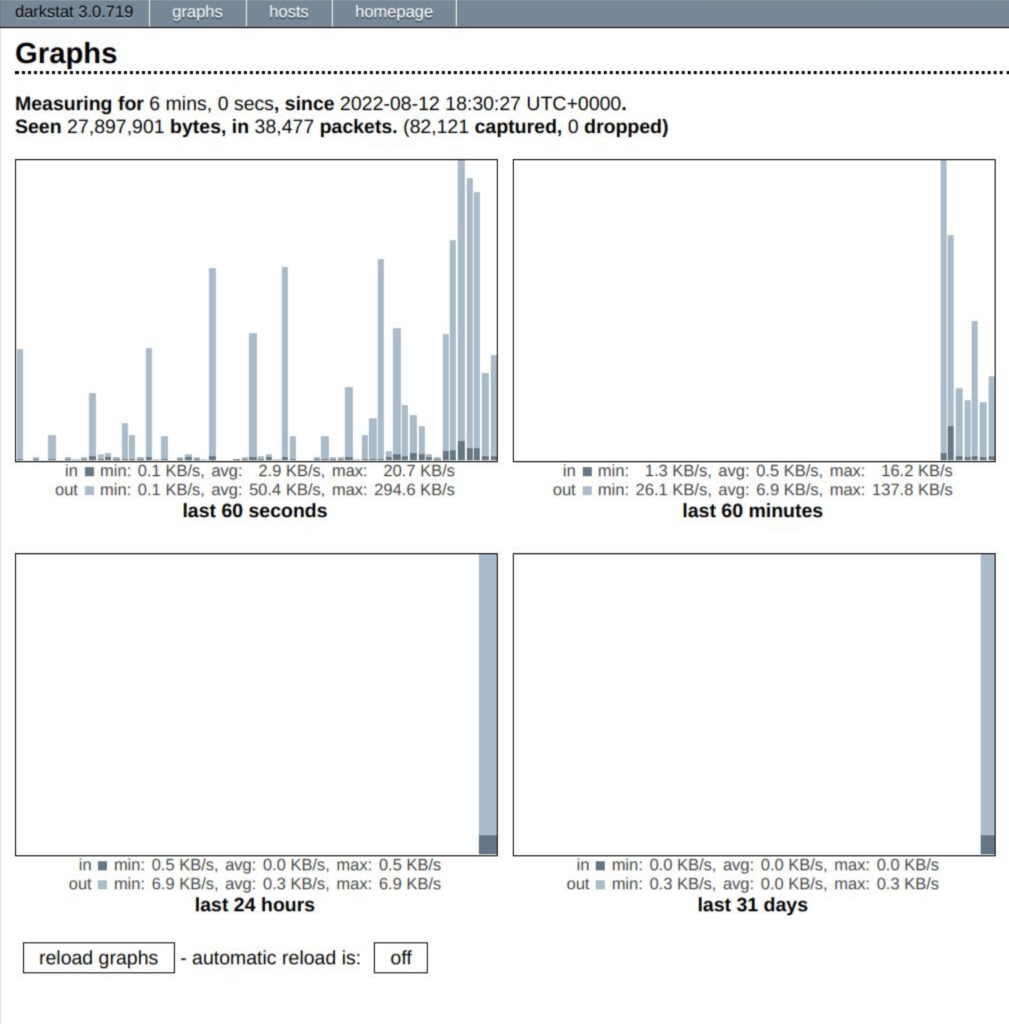
Darkstat is running and listening on port 666, in our case. Open your browser and go to the web address: http://localhost:666, or change the IP depending on how you configured your Darkstat application. The above address will take you to the web-based graphical interface of the Darkstat web analyzer tool, and it will look like the image below.
Automatic reload is set to Off but you can turn it On to load graphs automatically or click the Reload Graphs button every time you want to reload the graphs manually.
Using the Darkstat web analyzer will also give you access to a list of all the hosts that have tried to reach the server. You can access this list by clicking on the host section in the top-right corner of the screen.
Manage Darkstat via Command Line
The thing that makes this tool so amazing to use is that you can also manage it via the command line, without having to access its web interface. Let’s take a closer look at how you can manage Darkstat via the command line.
- To collect network statistics on the eth0 interface, we can use the
-iflag and execute the following command to retrieve the statistics.darkstat -i eth0
- To serve web pages on a specific web port you desire, include the -p flag and your desired port number in the command shown below.
darkstat -i eth0 -p 8080
- Use the
-fflag or filter flag to monitor the network statistics of a particular service. The filter flag we specify in the command below is going to capture traffic concerned with the SSH port.darkstat -i eth0 -f "port 22"
Shutdown Darkstat via Command Line
If you want to shutdown the Darkstat web traffic analyzer in a clean way using the command line, the best practice is to get the process id of its parent process and then send a SIGTERM or SIGINT to the Darkstat parent process.
To get the Darkstat parent process ID (or PPID) using the PIDOF command. Execute the following command to do so.
pidof darkstat
Next we kill the process after retrieving its ID by using 1 of the 2 commands listed below
sudo kill -SIGTERM 4790
OR
sudo kill -15 4790
man darkstat
Conclusion
In this tutorial, we learned what the Darkstat web analyzer is, how to install it on our system, how to configure it to capture web traffic, how to access the web UI, and how to manage Darkstat via the command line.


Great Site mate.
Hi, Sam. Thank you for the kind words. They’re very much appreciated!