Objectives
To manage all network activities you should have detailed knowledge about how to check network load, bandwidth usage, active connections, connections sockets, and how much bandwidth is used by processes on your Linux system.
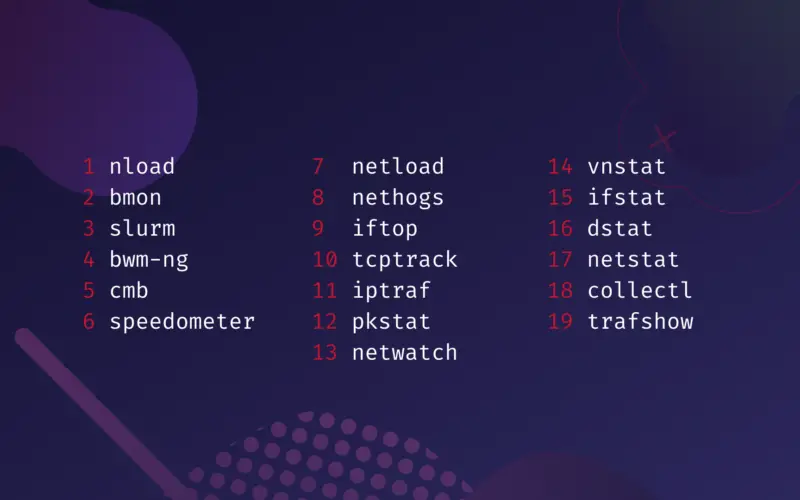
In this article, we will discuss 19 useful commands that help monitor your network activity on Linux. The commands are executed on Ubuntu 20.04 LTS. We will also show how to install these command-line tools or utilities in Ubuntu / Debian systems.
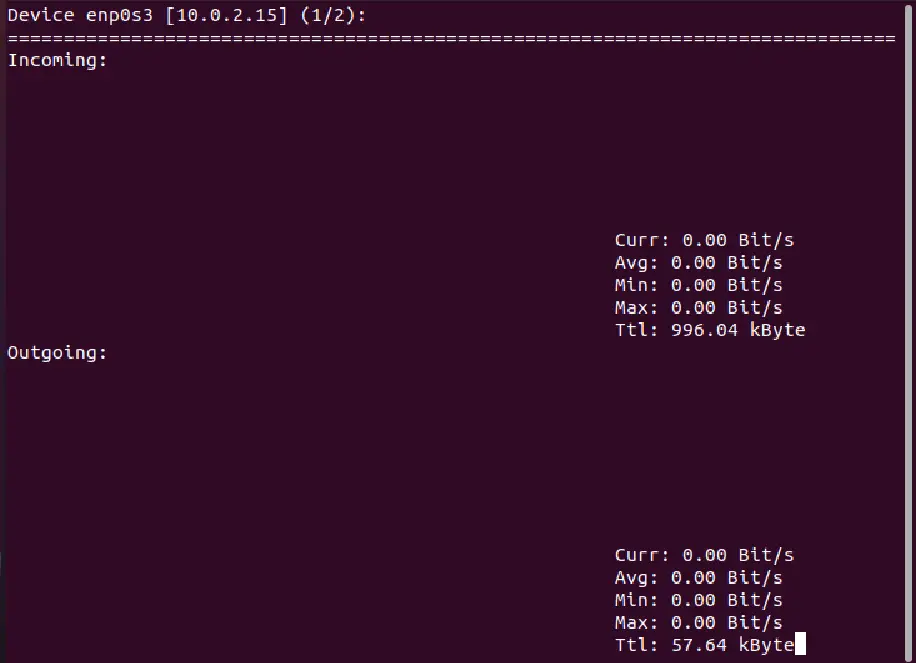
Nload – Monitors overall bandwidth, incoming and outgoing individual traffic
The nload is a command-line tool that monitors all incoming and outgoing individual network traffic. It shows the traffic output in the graphical format with an adjustable scale. Using the nload command-line tool, you can monitor the overall bandwidth usage without displaying the details of each process.
This tool is sufficient where you want to display the general use of bandwidth. To install the nload utility on the Linux Ubuntu/ Debian system, use the following command:
sudo apt-get install nload
nload
Bmon – Bandwidth monitor shows packet-level details
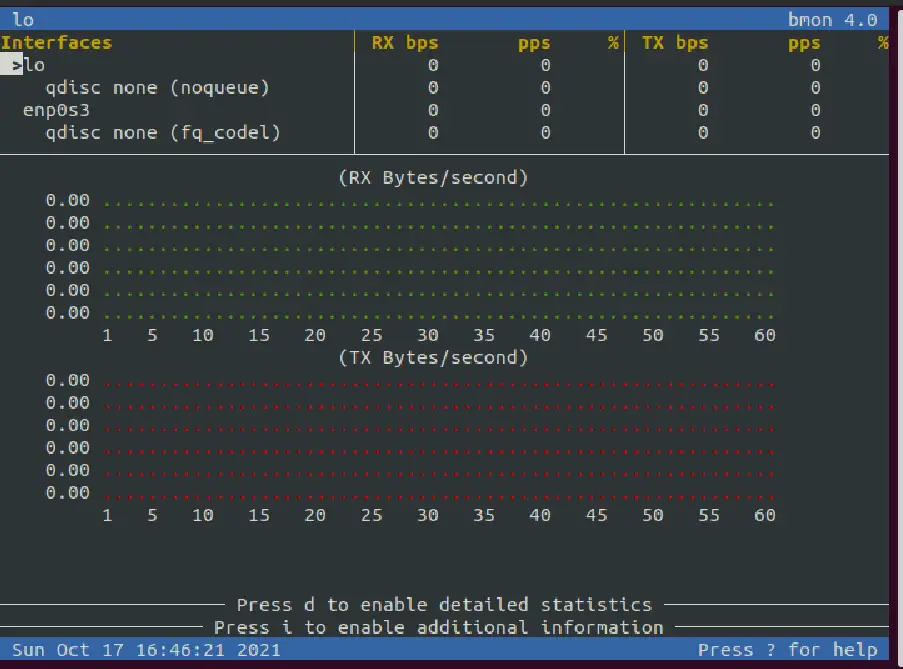
Bmon stands for ‘Bandwidth monitor’. This is also a command-line tool like the nload. It shows the traffic load within the network interface on your system. It can also show the output in the graph format that shows the packet-level traffic details. Using bmon, you can generate reports in HTML format.
To explore more options for bmon, visit the man pages. The bmon utility can be installed on almost all Linux distributions.
To install bmon on Ubuntu/ Debian distributions, use the following command:
sudo apt-get install bmon
bmon
Slurm – Monitors the network load by showing the device statistics and ASCII graph
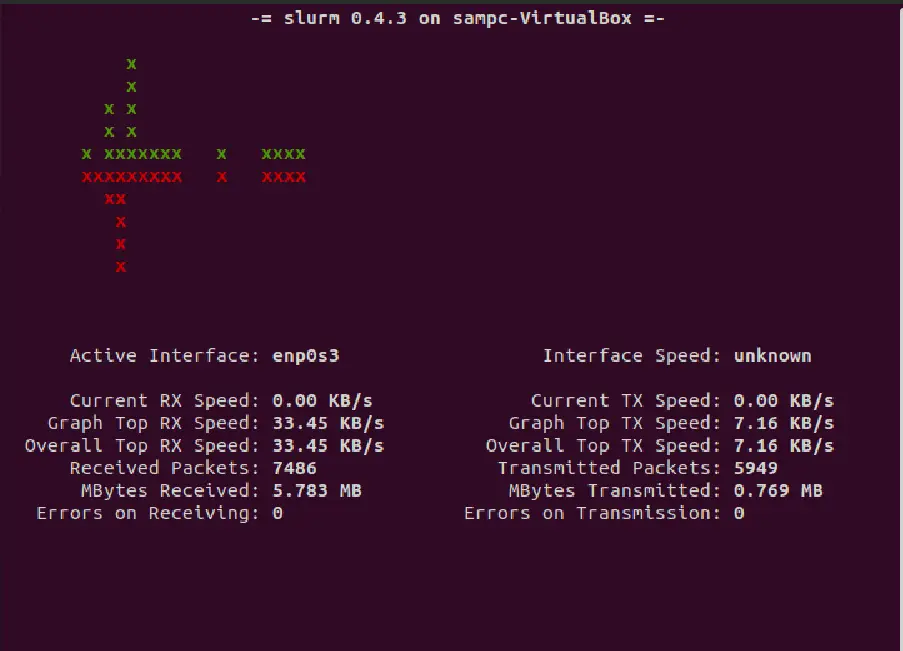
Slurm is another command-line utility used to monitor the network load by showing the device statistics and ASCII graph. The slurm tool generates three types of graphs that you can manage using c (classic mode), s (split graph mode), and l (large) options.
This is a simple tool only used to monitor the network load without displaying any other details about the network.
Install slurm on Ubuntu / Debian distributions by using the following command:
sudo apt-get install slurm
slurm -s -i enp0s3
Bwm-ng – Keeps track of the real-time network load
Bwm-ng stands for ‘Bandwidth Monitor Next Generation’ used to monitor the network bandwidth and keep track of the real-time network load. Using the bwm-ng tool, you can generate the report as an output that prints the complete summary of the speed at which data travels in and out from all the available system’s network interfaces.
Using the following commands, you can install this utility on your respective Linux distribution:
sudo apt-get install bwm-ng
bwm-ng

Color Bandwidth Meter (Cbm) – Displays the real-time updated traffic volume statistics
Cbm (Color Bandwidth Meter) is a command-line tool that displays information about the traffic volume by using a user-friendly system’s network interface. Cbm tool only displays the real-time updated traffic statistics. To install the cbm tool on Ubuntu / Debian distributions, run the below-mentioned command:
sudo apt-get install cbm
cbm

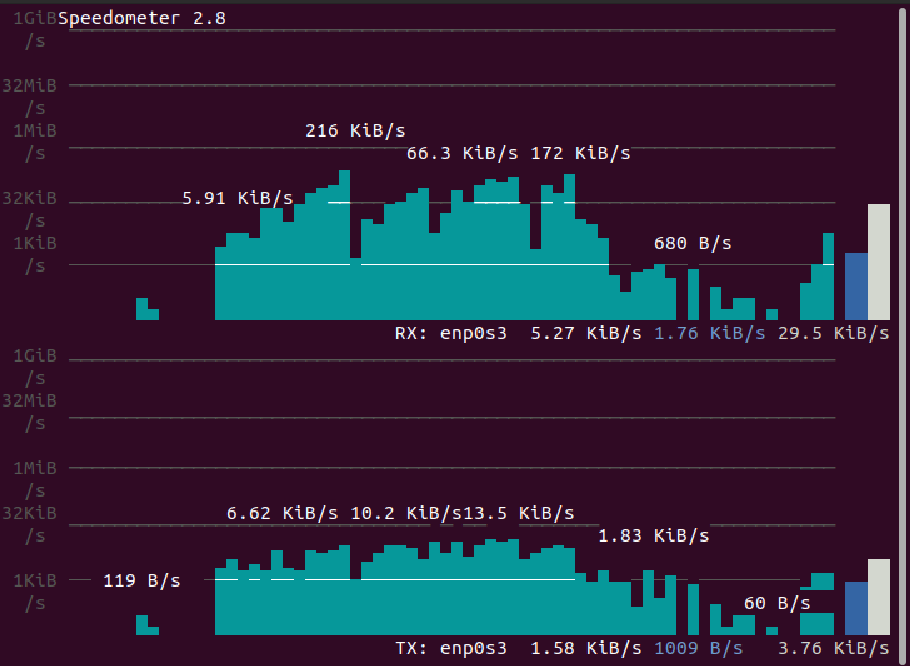
Speedometer – Displays network traffic on all network interfaces
The speedometer is also a command-line utility that displays the network traffic flowing in and out via all network interfaces in a graph format.
To install speedometer in Ubuntu / Debian distributions, use the following command:
sudo apt-get install speedometer
speedometer -r enp0s3 -t enp0s3
Netload – Displays current traffic load
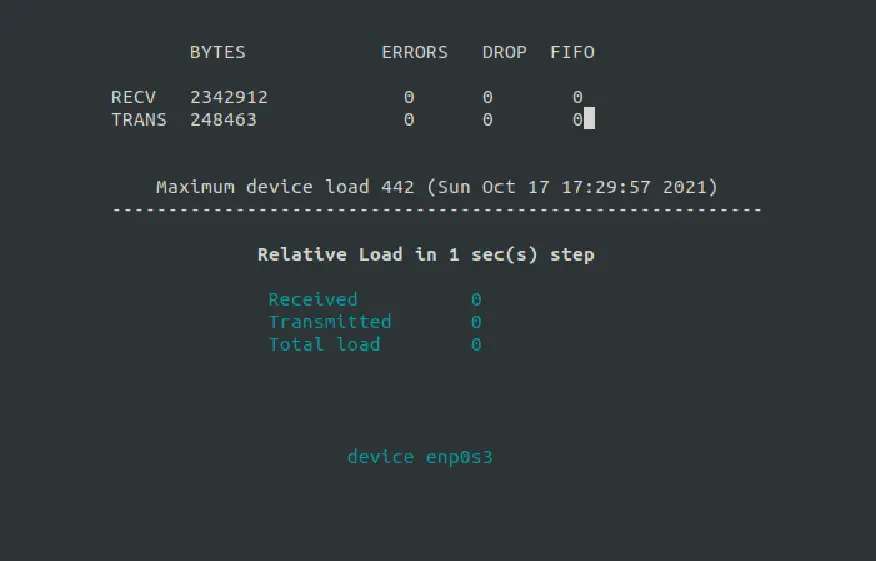
The netload is a command-line utility that displays the information about the current traffic load and the number of total bytes transferred during the process. To get the netload utility on Ubuntu / Debian distributions, run the following command:
sudo apt-get install netdiag
netload device-name
Nethogs – Displays the network bandwidth usage per process
Nethogs is a small ‘net top’ command-line utility that displays the network bandwidth used per process. The intensive processes use the most bandwidth put at the top of the list. This nethogs tool displays the complete report of PID, user, and program path. To install nethogs utility on Ubuntu / Debian distributions, run the command:
sudo apt-get install nethogs
nethogs

Iftop – Monitors the data flows through the socket connections
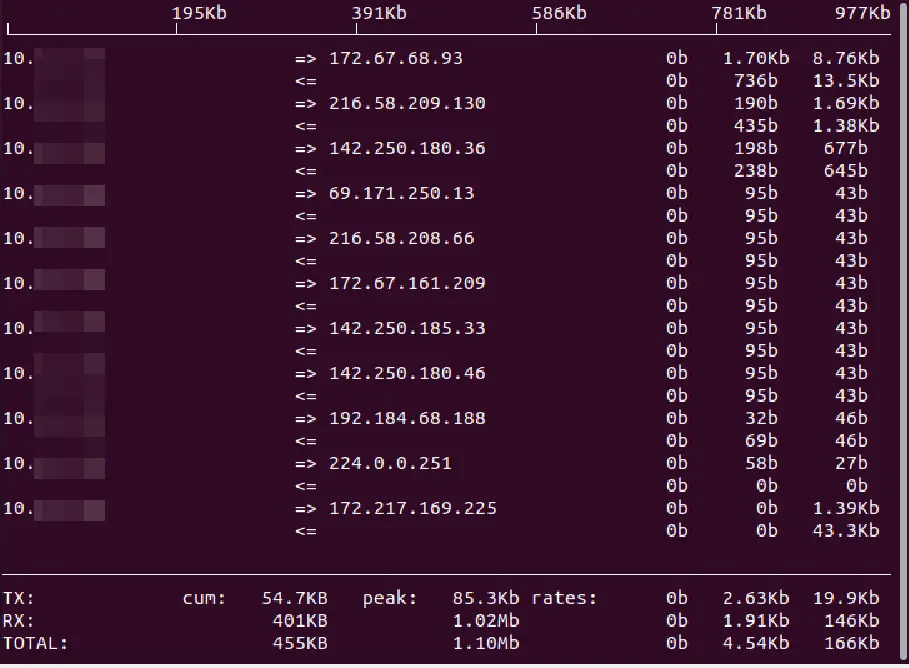
Iftop is a command-line tool used to monitor the traffic through socket connections. The iftop tool uses a pcap library that captures the packet movement to display the total bandwidth usage. This utility only shows the bandwidth used by individual connections without displaying the process details within that connection. Using the iftop utility, you can filter traffic and bandwidth usage over the specified host connections.
Install iftop utility on Ubuntu / Debian distributions using the command:
sudo apt-get install iftop
sudo iftop -n
In the above command, the -n option is used to prevent creating additional network traffic.
Tcptrack – Captures the packet’s movement using pcap library
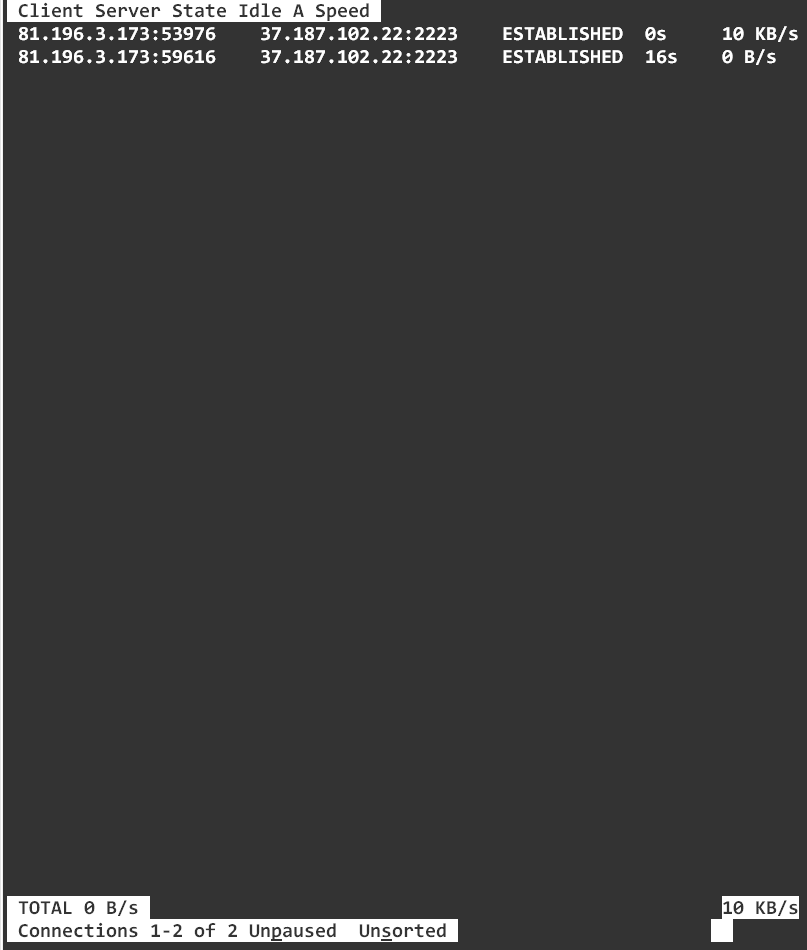
The tcptrack command-line utility works similarly toiftop. It also uses the pcap library to capture the packet’s movement to calculate the total bandwidth usage within each connection. Tcptrack supports standard pcap filters through which you can monitor the specific connections.
To install the tcptrack utility on Ubuntu / Debian distributions, run the command:
sudo apt-get install tcptrack
tcptrack -i eth0
Iptraf – Displays complete traffic summary based on the traffic protocol
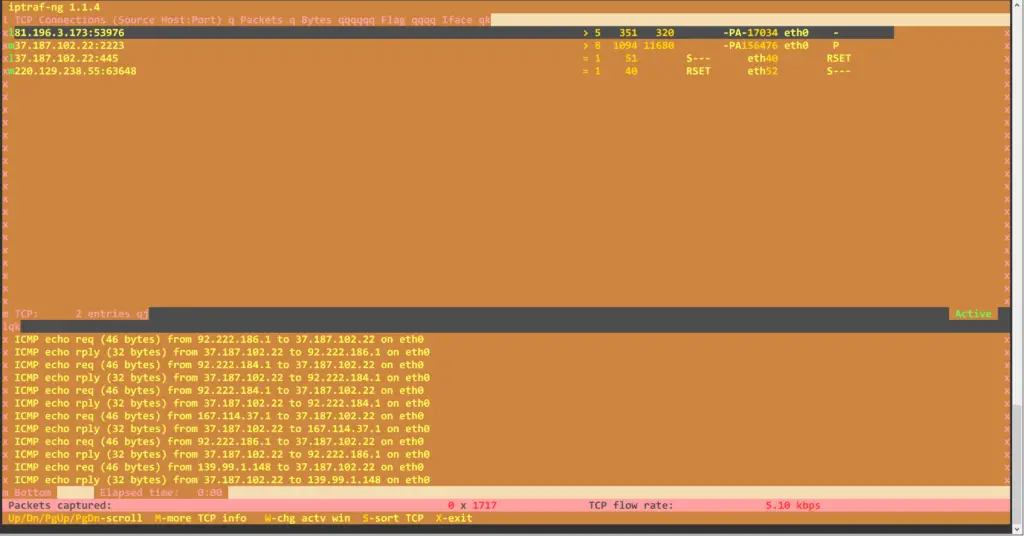
Iptraf gives much more details about the network traffic compared to iftop. The itraf command shows a complete traffic summary based on the traffic protocol. When you execute the iptraf, it displays the details of all TCP, UDP, ICMP, IP traffic in its output. It also helps you to find checksum errors in sending and receiving packets.
sudo apt-get install iptraf iptraf-ng
iptraf-ng -i eth0
Trafshow – Display information about active connections, transfer speed, and protocol of each connection
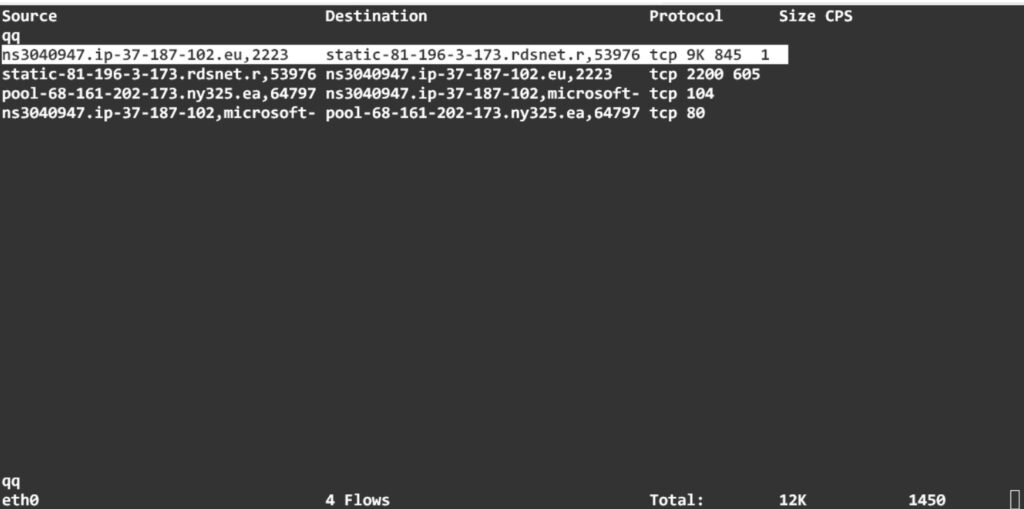
Trafshow common line tool behaves like the pkstat and netwatch commands. It shows the output in form of a report about all currently active connections, data transfer speed, and protocol of each connection. Using the trafshow utility, you can only monitor the TCP connection within the whole network. Trafshow can filter out connections using a pcap type library. This tool is a part of netdiag.
Install trafshow on Ubuntu / Debian distributions using the command:
sudo apt-get install netdiag
sudo trafshow -i eth0 tcp
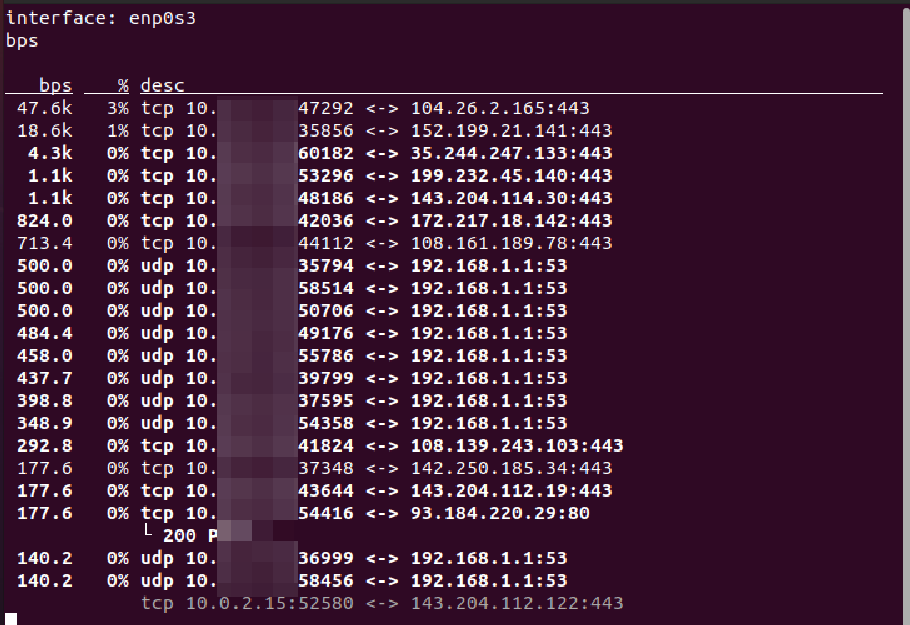
Pktstat – Prints a real-time report of all active connections
Pktstat command-line utility is used to print the real-time report of all active connections and shows the speed at which data is flowing through each connection. Pkstat utility also shows you the connection type such as TCP or UDP and also lists HTTP requests if involved.
To install the pkstat tool on Ubuntu / Debian system, use the below-mentioned command:
sudo apt-get install pktstat
pktstat -i enp0s3 -nt
Netwatch – Displays the network connections between the local host and other remote hosts
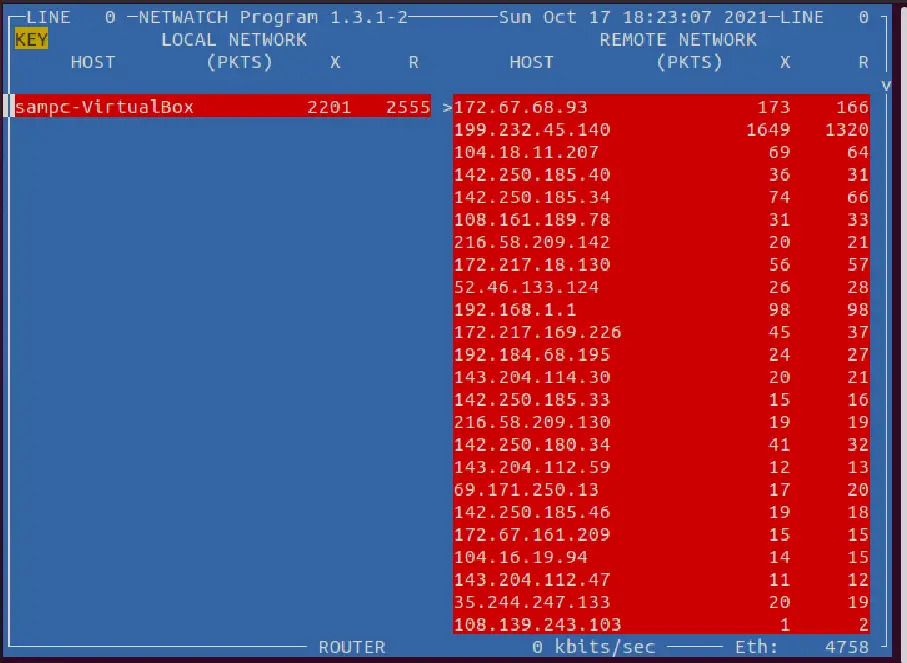
Netwatch command is also included in netdiag tools that display the network connections between the local host and other remote hosts. It shows the speed at which the data flows between those connections. To get this tool on Ubuntu / Debian system, run the below-mentioned command:
sudo apt-get install netdiag
sudo netwatch -e enp0s3 -nt
Vnstat – Background service/daemon
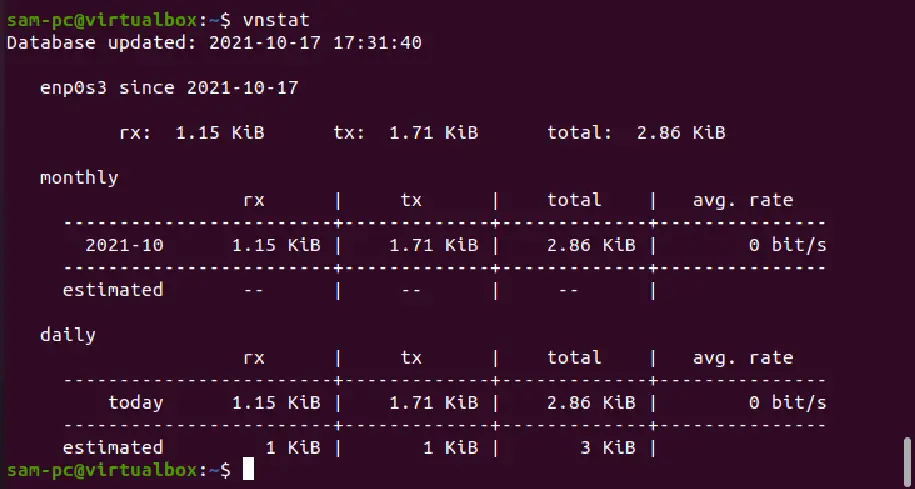
Vnstat is quite different from other network monitoring tools. It runs as a background service/daemon on your system. It keeps a record of data transferred all the time through the network. Further, using the vnstat utility, you can generate the history of network usage in the report format.
To install vnstat on Ubuntu / Debian system, execute the following command:
sudo apt-get install vnstat
vnstat
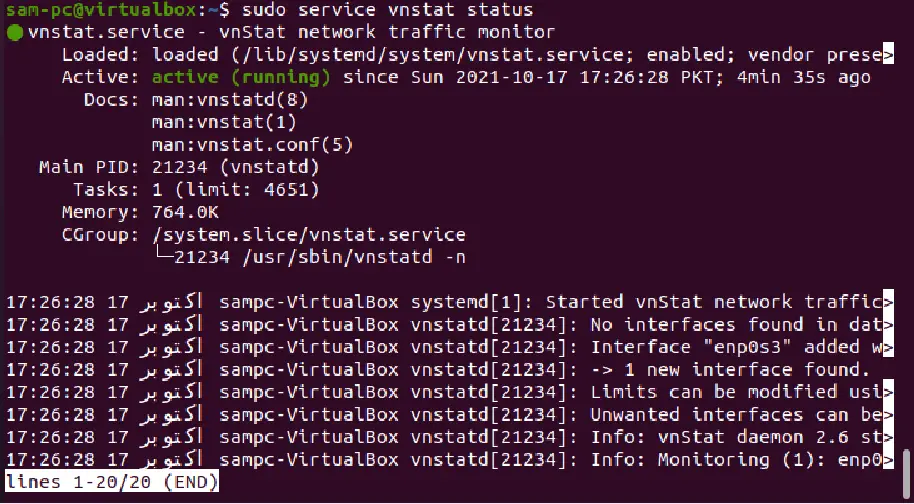
To check the running status of the vnstat service, use the below-mentioned command:
sudo service vnstat status
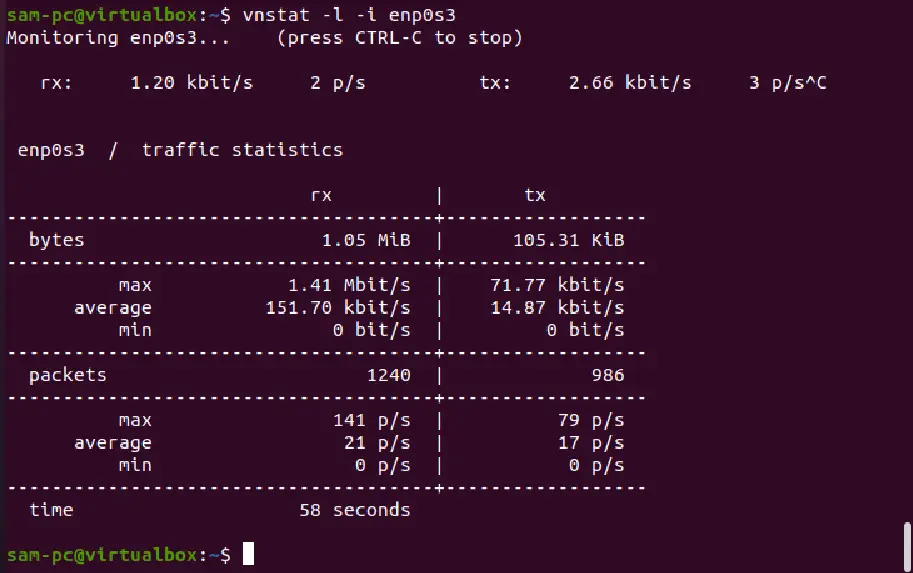
You can use different options vnstat. But, if you don’t use any parameter then, it displays the total amount of data transfer since the vnstat daemon’s start. If you want to view the real-time bandwidth usage then, use the option -I (live mode). In this case, it will show the precise summary of the total bandwidth used by all incoming and outgoing data.
vnstat -l -i enp0s3
It will not show additional details about the processes and host connections. To explore more vnstat options, visit the man page of the vnstat command.
Ifstat – Displays network bandwidth report in batch-style mode
The ifstat command output shows a format that is easy to log and parse by using the other tools. To install the ifstat utility on Ubuntu / Debian distribution, type the following command:
sudo apt-get install ifstat
ifstat -t -i enp0s3 0.7

dstat – Monitors the system statistics and displays output in the form of a report in batch-style mode
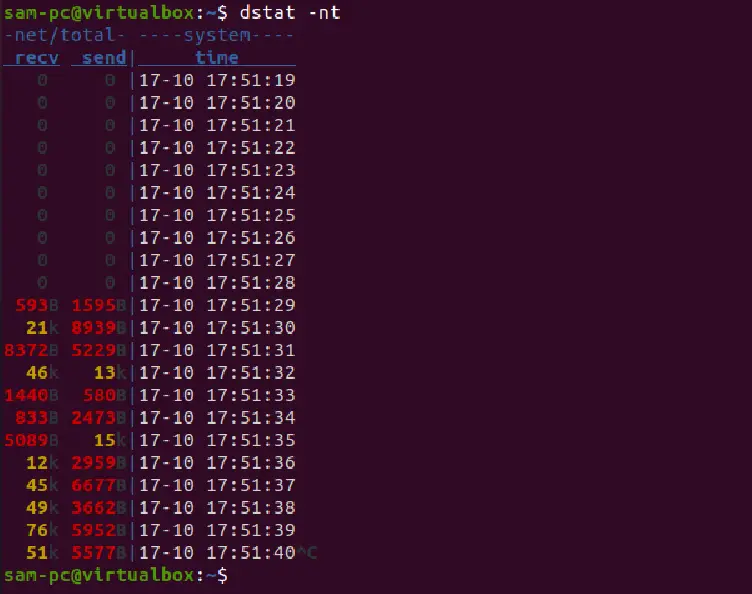
The dstat command-line tool is written in Python. It monitors the system statistics and displays output in the form of a report in batch-style mode. It can also log the data in CSV or similar file format.
Install the dstat utility on Debian / Ubuntu distribution using the below-given command:
sudo apt-get install dstat
To report network bandwidth using the dstat command, use the following command:
dstat -nt
Netstat command – Prints all network connections, routing tables, network interface statistics, multicast membership details
Netstat stands for network statistics. It is a powerful command-line utility that prints all network connections, routing tables, network interface statistics, multicast membership, and details about the masquerade connections. To use this utility on Ubuntu/ Debian Linux system, install the necessary net-tools by running the following command:
sudo apt install net-tools
Using the netstat command, you can display all listening processes by using the following command:
sudo netstat -tulpen
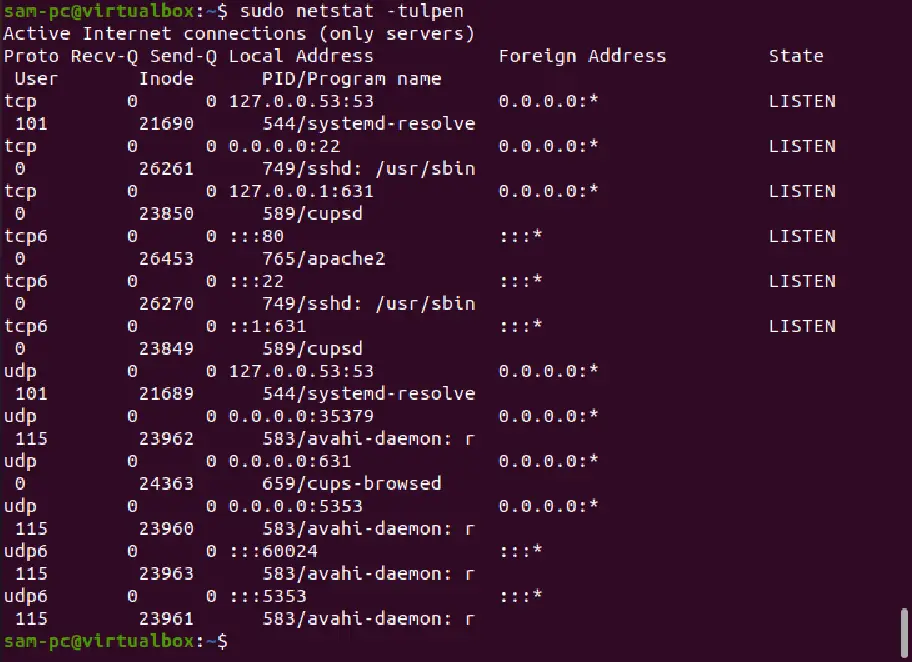
In the above command -tulpen provides the following information:
t displays TCP connections
u shows UDP connections
l display only the listening sockets
p prints the program to which network connection belongs
e prints extended details
n shows addresses, ports, and users’ information numerically.
By executing the below-mentioned command, you can view all current network connections:
sudo netstat -atupen
The above command performs the same function here, -a option lists all network sockets.
Collectl – Collects statistics from different system resources
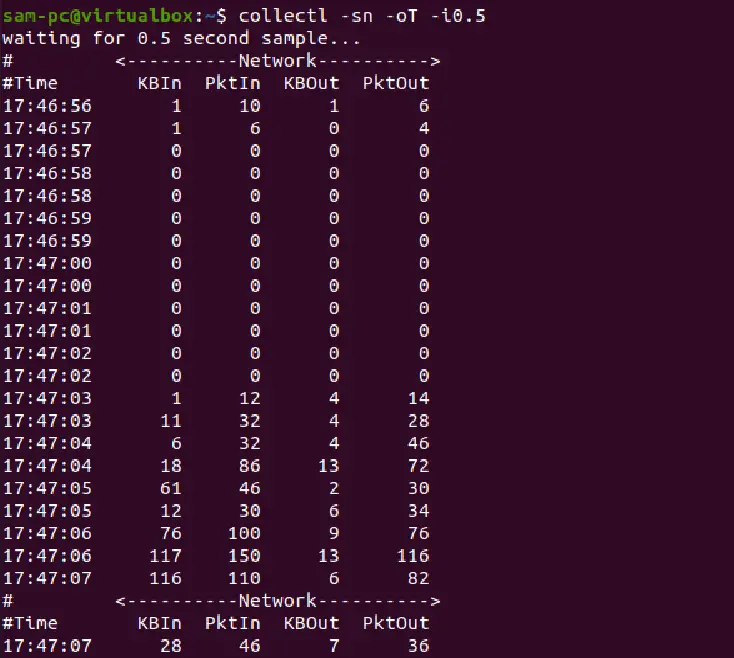
Collectl works similar to the dstat command. It gathers statistics from different system resources such as Memory, Network, and CPU.
You can install collectl utility on Ubuntu / Debian distribution as follows:
sudo apt-get install collectl
Here we an example of how to use collectl to report the network usage or bandwidth.
collectl -sn -oT -i0.5
Conclusion
We learned 19 useful commands that can help you to monitor network activities Linux.
The above commands nload, slurm, bmon, bwm-ng, cbm, speedometer, and netload provide the overall bandwidth statistics of your network.
The commands vnstat, dstat, ifstat, and collectl display the overall bandwidth statistics in batch-style mode.
The commands iftop, iptraf, pktstat, tcptrack, netwatch, and trafshow display results based on the bandwidth usage per socket connection.
To view the bandwidth usage per process nethogs command helps you in this case.
